Quick start
**Video tutorials are available. Run pip install gcode2dplotterart then head over to YouTube to watch the 2D Plotter or 3D Printer tutorials. **
This guide covers setup for both 2D plotter and 3D printers. Instructions at certain steps will differ based on if a 2D plotter or 3D printer is being used. Additionally, specific devices will require some extra setup steps and will be noted with an additional section of 2D plotter or 3D printer.
0. Reference the Terminology
It is useful to keep the terminology help doc open while reading through the quick start.
1. Install dependencies
Install the Python package with pip install gcode2dplotterart and the Universal G-Code Sender software.
2. Setup Hardware
2D plotter
No special setup required.
3D printer
Follow the guide to Convert a 3D printer to a 2D plotter.
3. Learn about UGS
If the Universal G-Code Sender application has never been used before, it is recommended to read this article.
4. Get Plotting Device Dimensions and Feed Rate
The plotting device's dimensions act as a constraint to make sure anything that is plotted in code will physically fit within the bounds of the plotting device. Get the plotting device's dimensions.
The feed rate is a measure of how quickly the plotter head can move. It's good to tweak this so that the plotting device moves not too fast that it'll create imperfections and not too slow that plotting takes forever. Get the plotting device's feed rate.
Fill in the plotting device's dimensions and feed rate below.
2D plotter
from gcode2dplotterart import Plotter2D

plotter=Plotter2D(
  title="Plotter2D Quickstart",

  # The following 4 values are from the `Get the plotting device's dimensions` article above.
  x_min=0, # This will be the value `X-` or 0
  x_max=200, # This will be the value `X+`
  y_min=0, # This will be the value `Y-` or 0
  y_max=200, # This will be the value `Y+` or 0

  # This value is from the `Get the plotting device's feed rate` article above.
  feed_rate=0,

  output_directory="./output",
  handle_out_of_bounds='Warning' # If a plotted point is outside of the bounds, give a warning, don't plot the point, and keep going.
)
3D printer
from gcode2dplotterart import Plotter3D

plotter=Plotter3D(
  title="Plotter3D Quickstart",

  # The following 6 values are from the `Get the plotting device's dimensions` article above.
  x_min=0, # This will be the value `X-` or 0
  x_max=200, # This will be the value `X+`
  y_min=0, # This will be the value `Y-` or 0
  y_max=200, # This will be the value `Y+` or 0
  z_plotting_height=0, # This will be the value of `Z` that connects the plotter head to the plotting surface.
  z_navigation_height=3, # This will be the value of `Z` that separate the plotter head from the plotting surface.

  # This value is from the `Get the plotting device's feed rate` article above.
  feed_rate=0,

  output_directory="./output",
  handle_out_of_bounds='Warning' # If a plotted point is outside of the bounds, give a warning, don't plot the point, and keep going.
)
5. Add a layer
A layer is a group of instructions that will be executed sequentially. It usually makes sense to create layers based on the plotting instruments being used.
Several layers can be added to plot with different colors. The color value is used to generate a preview before plotting. A hex color (such as #00FF00) or human readable color name (see MatplotLib for list of supported color names) can be used.
black_pen_layer = "black_pen_layer"
blue_marker_layer = "blue_marker_layer"
green_marker_layer = "green_marker_layer"

plotter.add_layer(black_pen_layer, color="black", line_width=1.0)
plotter.add_layer(blue_marker_layer, color="blue", line_width=4.0)
plotter.add_layer(green_marker_layer, color="#027F00", line_width=4.0)
6. Add lines, shapes, and paths to the layers
Once a layer is created, start appending instructions to that layer. Note that the points should fit inside the plotting device's bounds, or else warnings will be seen when executing the script.
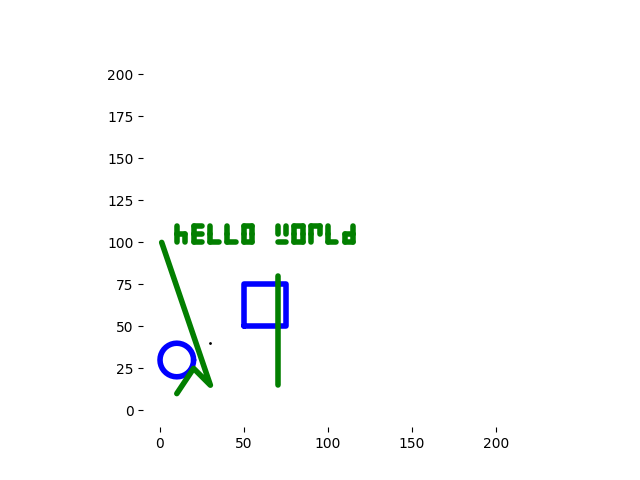
plotter.layers[black_pen_layer].add_point(x=30, y=40)
plotter.layers[blue_marker_layer].add_circle(x_center=10, y_center=30, radius=10)
plotter.layers[blue_marker_layer].add_rectangle(x_start=50, y_start=50, x_end=75, y_end=75)
plotter.layers[green_marker_layer].add_path([(10, 10), (20, 25), (30, 15), (1, 100)])
plotter.layers[green_marker_layer].add_line(x_start=70, y_start=80, x_end=70, y_end=15)
plotter.layers[green_marker_layer].add_text("hello world", x_start=10, y_start=10, font_size=10)
add_point, add_circle, add_rectangle, and other similar methods are all wrappers around add_path. The add_path method is the most flexible and can be used to create any path.
7. Generate a preview
plotter.preview()
This will open up a preview of what will be plotted. This can be useful to spot check the G-Code instructions before plotting begins.

8. Save layers to file
plotter.save()
Inside the folder specified by the plotter's output_directory and title there will be four files preview.gcode, blue_marker_layer.gcode, black_pen_layer.gcode, and green_marker_layer.gcode. Each of the files can be opened and the code browsed. The G-Code Overview includes explanations of all of the instructions used in this library.
7. Plot
Be sure to Reset Zero every time the plotting device is powered on.
In UGS, open up the preview.gcode file. This won't plot anything but will give a preview of how large the plotting area will be. It's useful to run this command a few times to ensure that the plotting surface is where it's expected to be and things are aligned horizontally and vertically. Open the next gcode file for the first layer to be plotted. Attach the drawing instrument and begin plotting. Repeat the process for each layer.
8. Read the documentation
3D Printer
2D Plotter
9. Next steps
Check out the plotting tips and coding tips. Find some inspiration in the plotting gallery.
Create something cool or need help? Join us on Discord!