2023-7-15 Bunch of Lines
Description
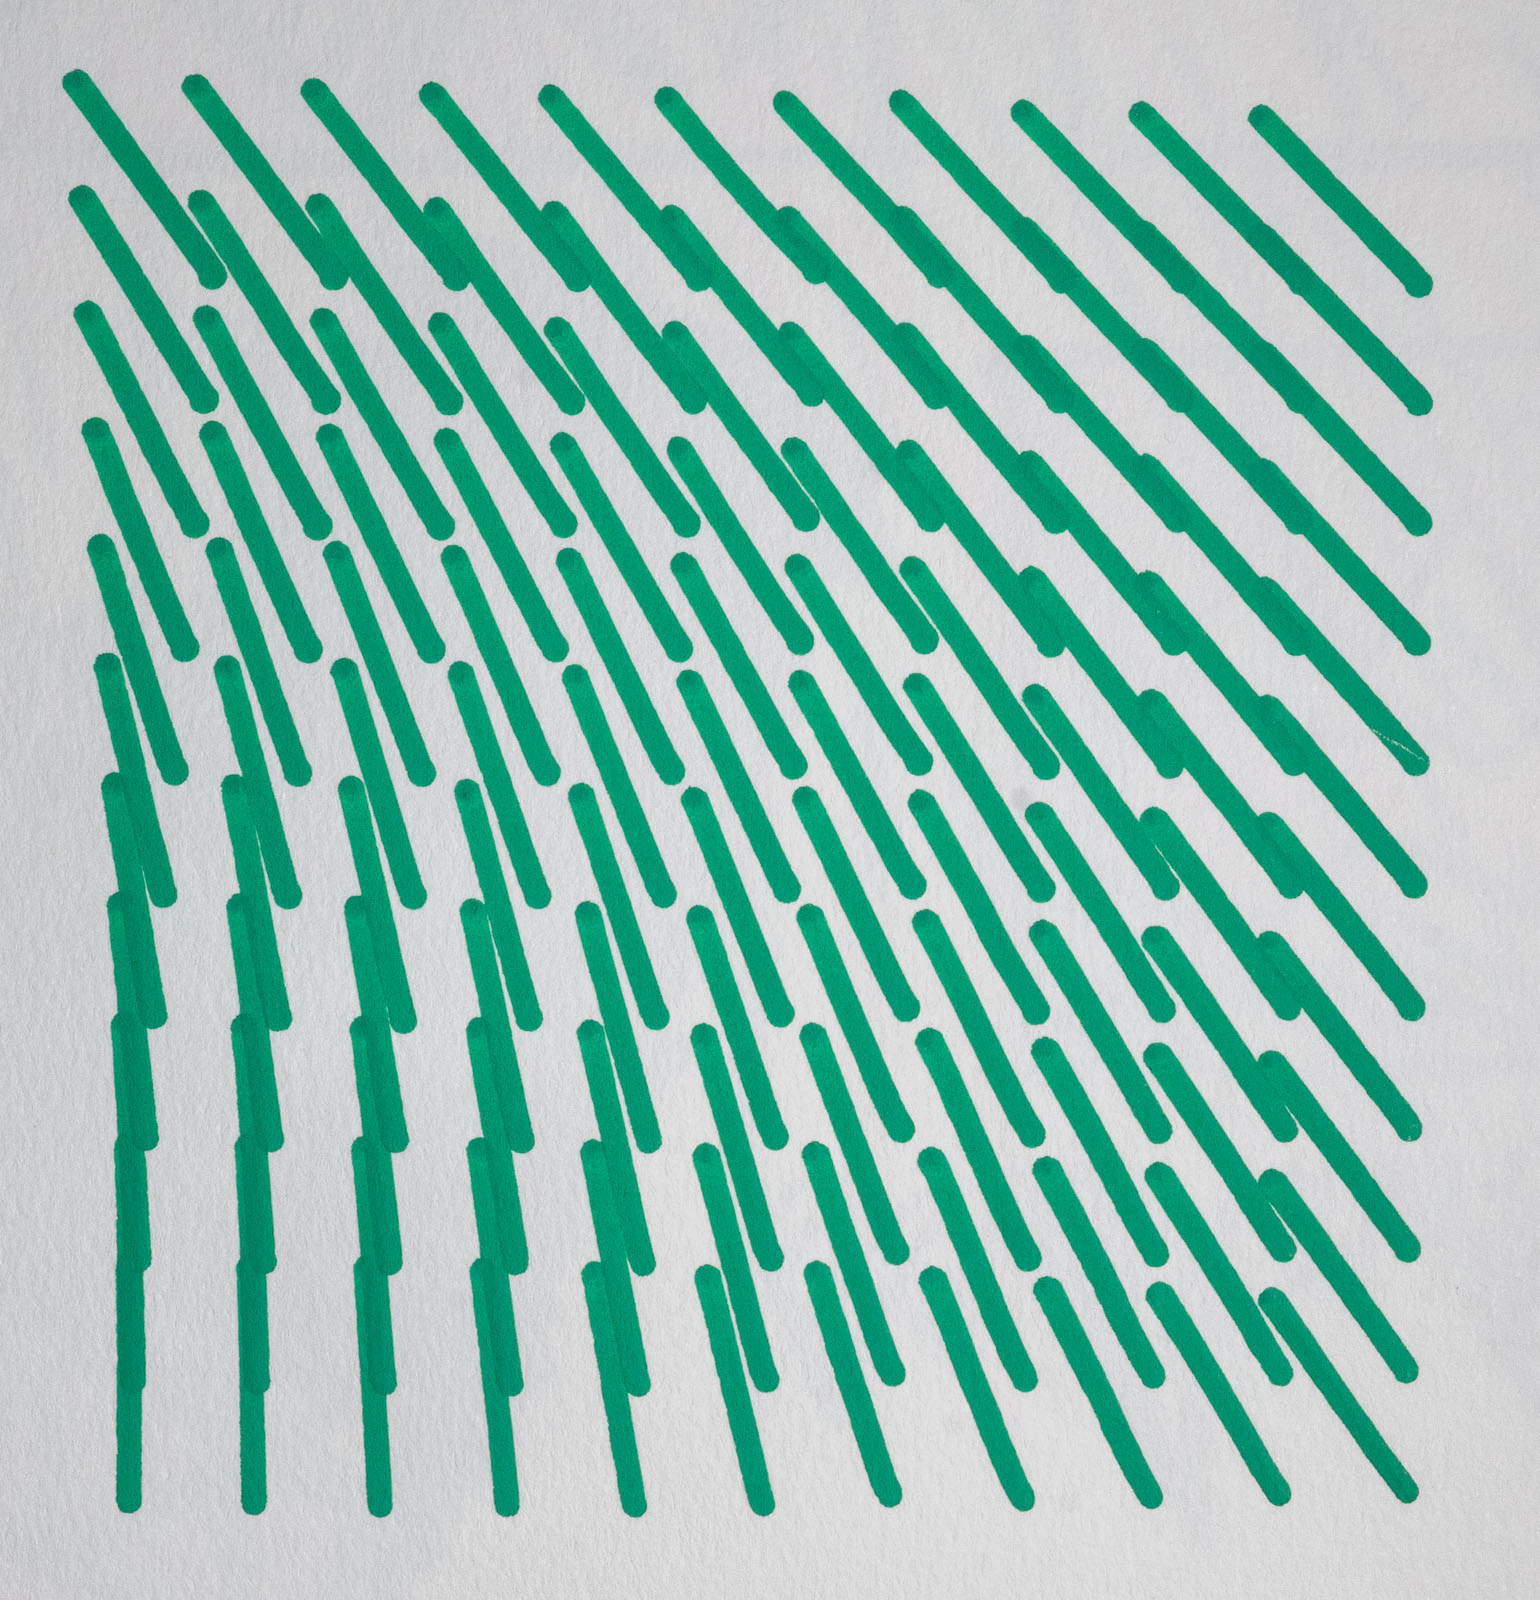
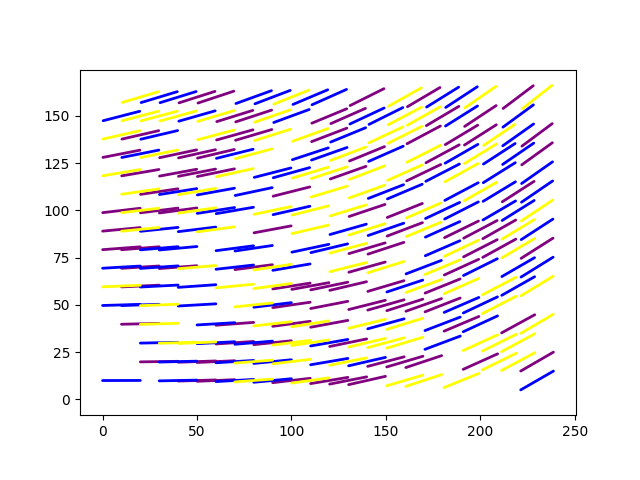
Take in a color. Plot a bunch of lines in a grid with a fixed length and a variable slope.
Images


Plotter Preview

Code
from gcode2dplotterart import Plotter2D
from math import sin
from random import randint

plotter = Plotter2D(
    title="Bunch of Lines",
    x_min=0,
    x_max=240,
    y_min=0,
    y_max=170,
    feed_rate=10000,
    output_directory="./output",
    handle_out_of_bounds="Warning",
)

COLORS = ["purple", "blue", "yellow"]
HYPOTENUSE = 10

for color in COLORS:
    plotter.add_layer(title=color, color=color)

for x0 in range(plotter.x_min, plotter.x_max, 10):
    for y0 in range(plotter.y_min, plotter.y_max, 10):
        slope = sin((x0**2 + y0**2) / (plotter.x_max**2 + plotter.y_max**2))

        delta_x = HYPOTENUSE * (1 / (1 + slope**2)) ** 0.5
        delta_y = delta_x * slope

        x1 = x0 - delta_x
        y1 = y0 - delta_y

        x2 = x0 + delta_x
        y2 = y0 + delta_y

        rand = randint(0, len(COLORS))
        if rand == len(COLORS):
            # Every so often don't plot a line. For Art.
            continue

        plotter.layers[COLORS[rand]].add_line(x1, y1, x2, y2)


plotter.preview()
plotter.save()