2023-11-28 Josef Albers Recursive Homage
Description
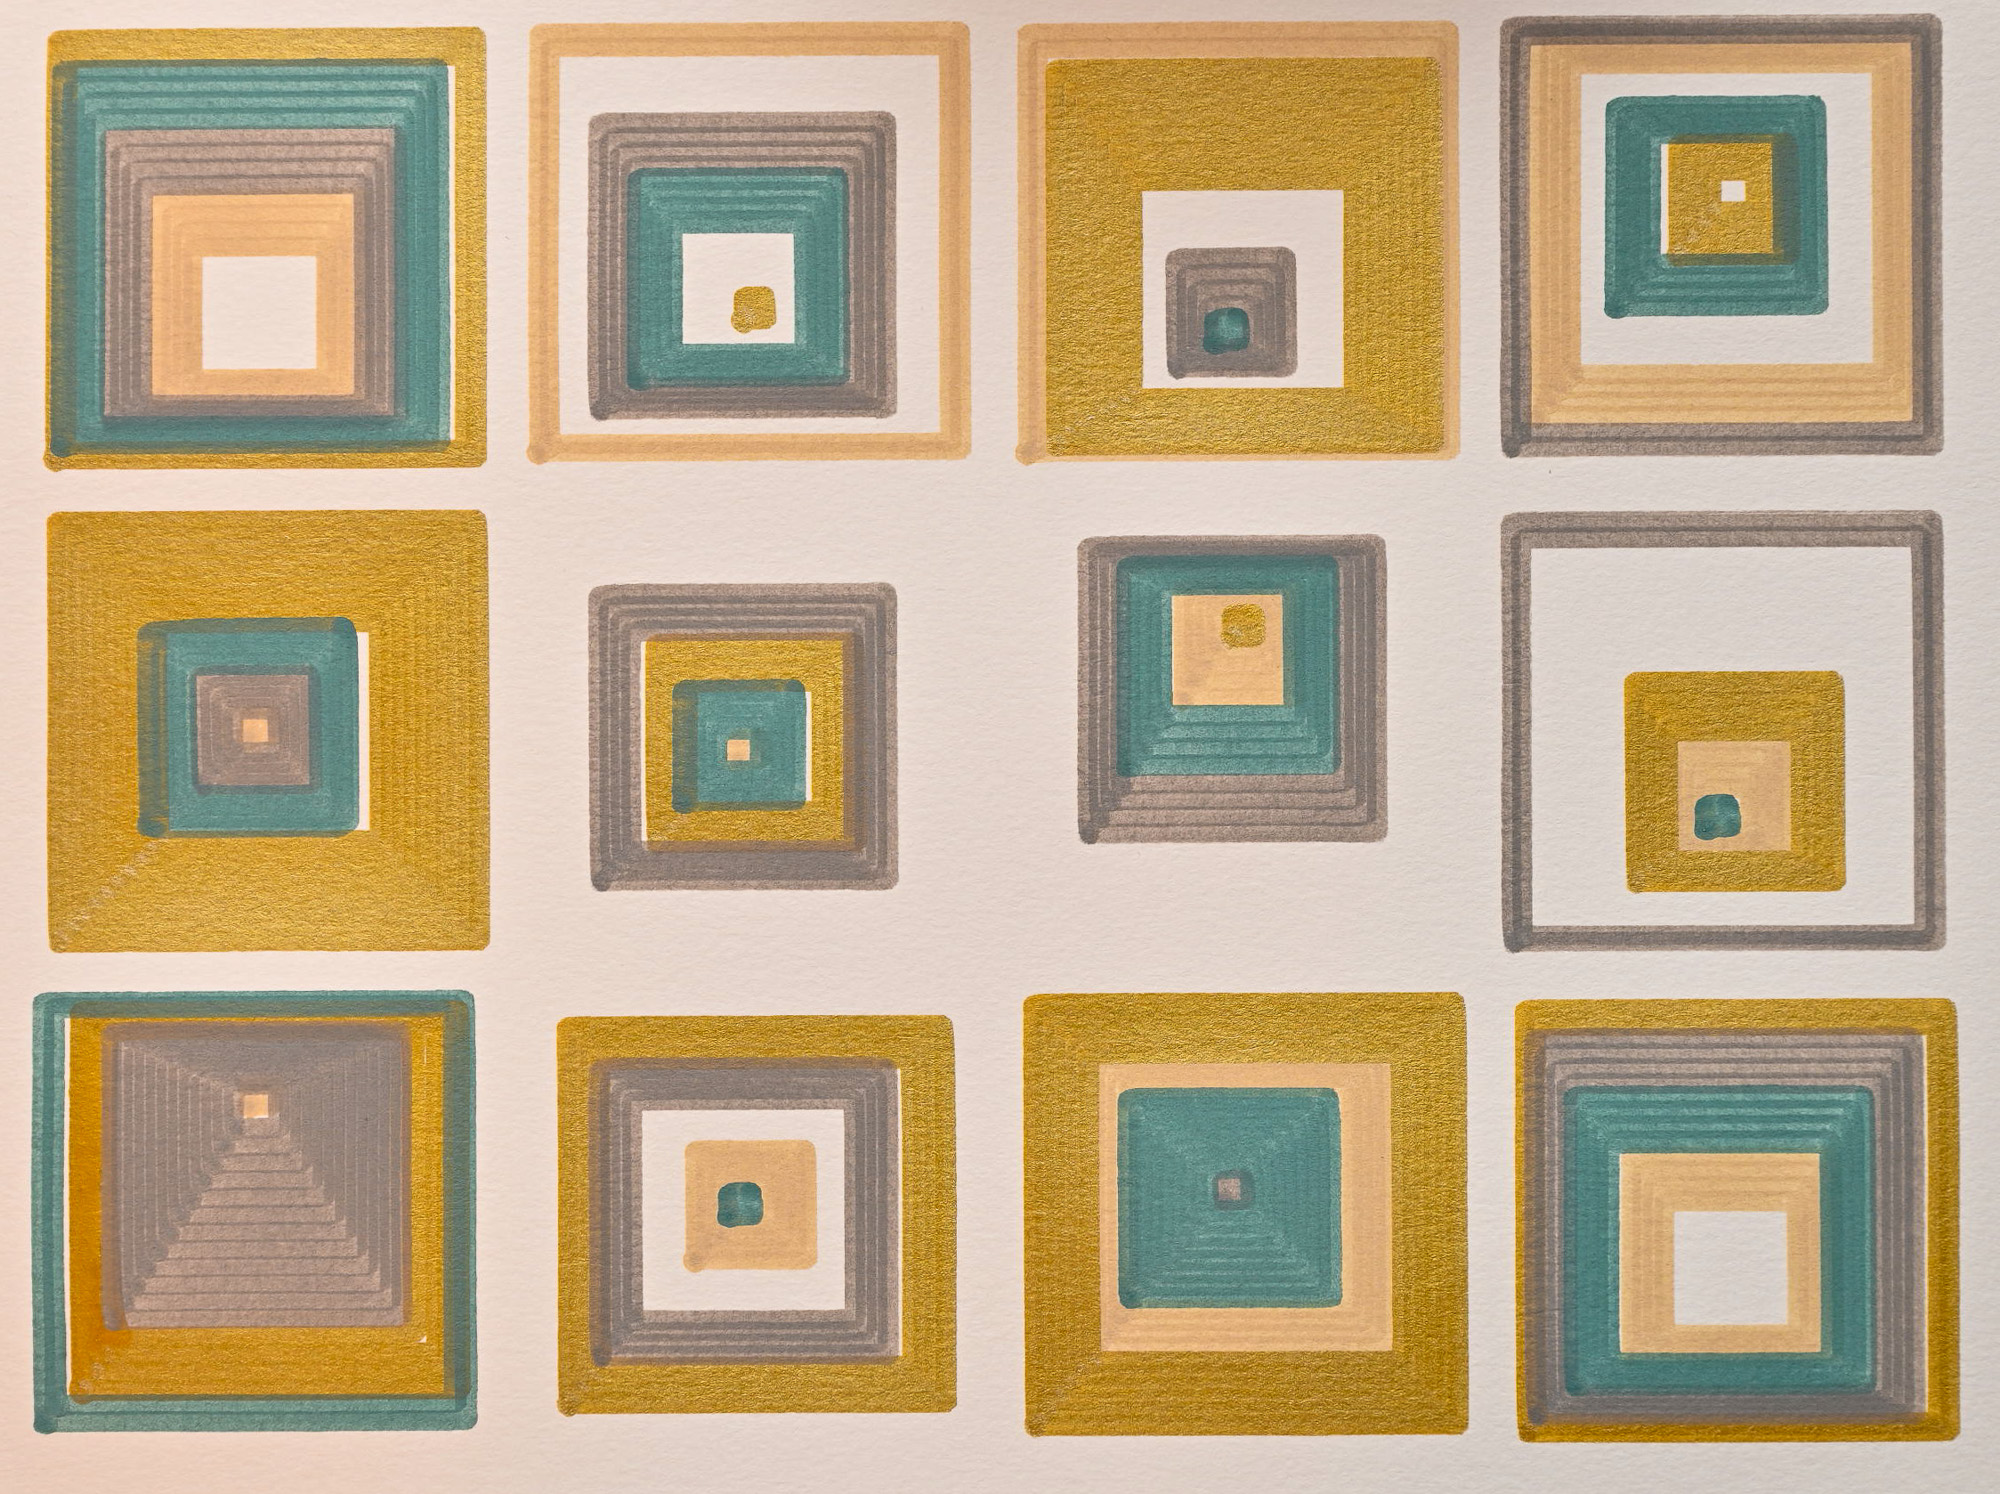
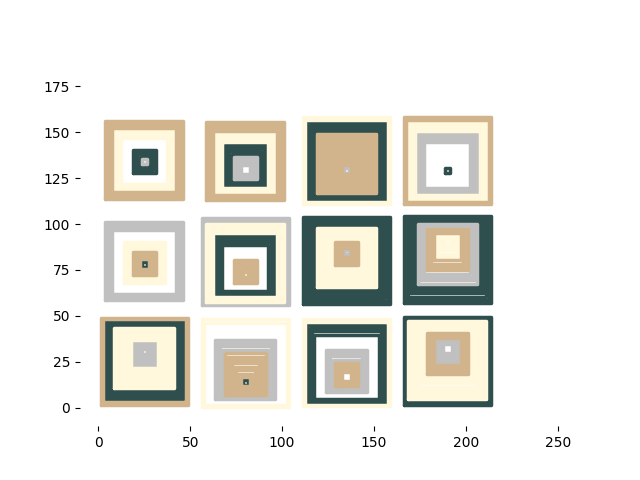
An homage to Josef Albers, recursively.
Images

Plotter Preview

Code
from gcode2dplotterart import Plotter2D
from random import randrange, shuffle
import math


LINE_WIDTH = 2.5

COLORS = [
    {"title": "color1", "color": "darkslategrey"},
    {"title": "color2", "color": "silver"},
    {"title": "color3", "color": "cornsilk"},
    {"title": "color4", "color": "tan"},
]

plotter = Plotter2D(
    title="Josef Albers Homage",
    x_min=0,
    x_max=250,
    y_min=0,
    y_max=180,
    feed_rate=10000,
)

DONT_PLOT_LAYER = {
    "title": "DONT PLOT",
    "color": "#FFFFFF",
    "line_width": LINE_WIDTH,
}
plotter.add_layer(**DONT_PLOT_LAYER)

for color in COLORS:
    plotter.add_layer(
        title=color["title"],
        color=color["color"],
        line_width=LINE_WIDTH,
    )

# Should be less than 100 so that the last square can be one later on.
SIDE_LENGTH_PERCENTAGE_CHOICES = [i / 100 for i in range(10, 99, 20)]


def josef_albers(x_min: float, y_min: float, side_length: float):
    colors = COLORS.copy()

    # Append some number of white layers.
    for i in range(randrange(0, 3)):
        colors.append(DONT_PLOT_LAYER)

    shuffle(colors)

    side_padding = LINE_WIDTH * 5
    x_center = x_min + side_length / 2
    y_center = randrange(
        int(y_min + side_padding), int(y_min + side_length - side_padding)
    )

    vertical_angle = math.degrees(math.atan(int(side_length / 2) / (y_center - y_min)))

    shuffle(SIDE_LENGTH_PERCENTAGE_CHOICES)
    square_side_length_percentages = SIDE_LENGTH_PERCENTAGE_CHOICES[: len(colors) - 1]
    square_side_length_percentages.append(1)

    square_side_lengths = sorted(
        [int(side_length * percentage) for percentage in square_side_length_percentages]
    )

    current_side_length = LINE_WIDTH
    for index, color in enumerate(colors):
        threshold_side_length = square_side_lengths[index]

        while current_side_length < threshold_side_length:
            x_left_of_center = current_side_length / 2
            y_below_center = x_left_of_center / math.tan(math.radians(vertical_angle))
            x_start = x_center - x_left_of_center
            y_start = y_center - y_below_center

            x_end = x_start + current_side_length
            y_end = y_start + current_side_length

            plotter.layers[color["title"]].add_rectangle(
                x_start=x_start,
                y_start=y_start,
                x_end=x_end,
                y_end=y_end,
            )

            current_side_length += LINE_WIDTH


SIDE_LENGTH = 50

for x in range(0, plotter.width - SIDE_LENGTH, SIDE_LENGTH + 5):
    for y in range(0, plotter.height - SIDE_LENGTH, SIDE_LENGTH + 5):
        josef_albers(x, y, SIDE_LENGTH)

plotter.preview()
plotter.save()