2023-11-15 Image Lines
Description
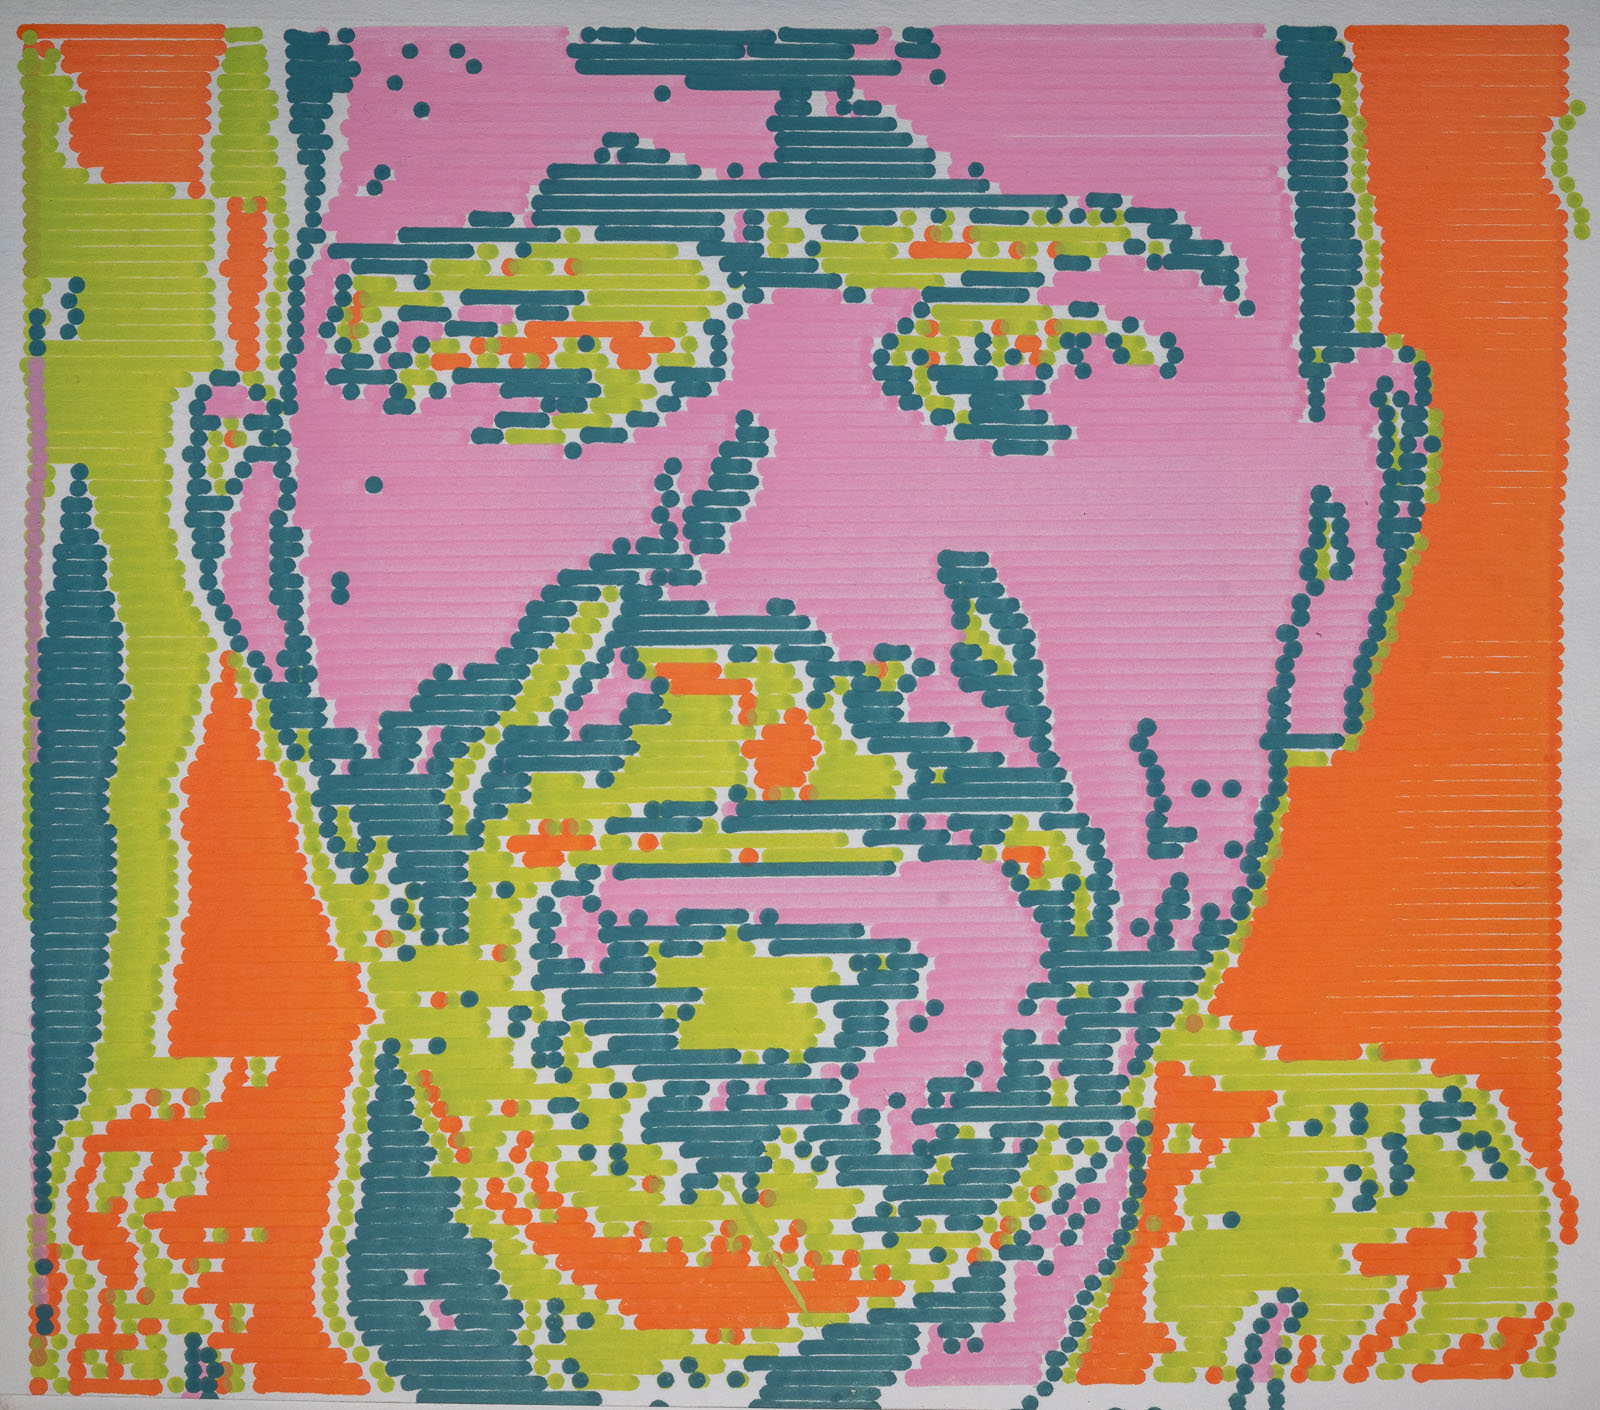
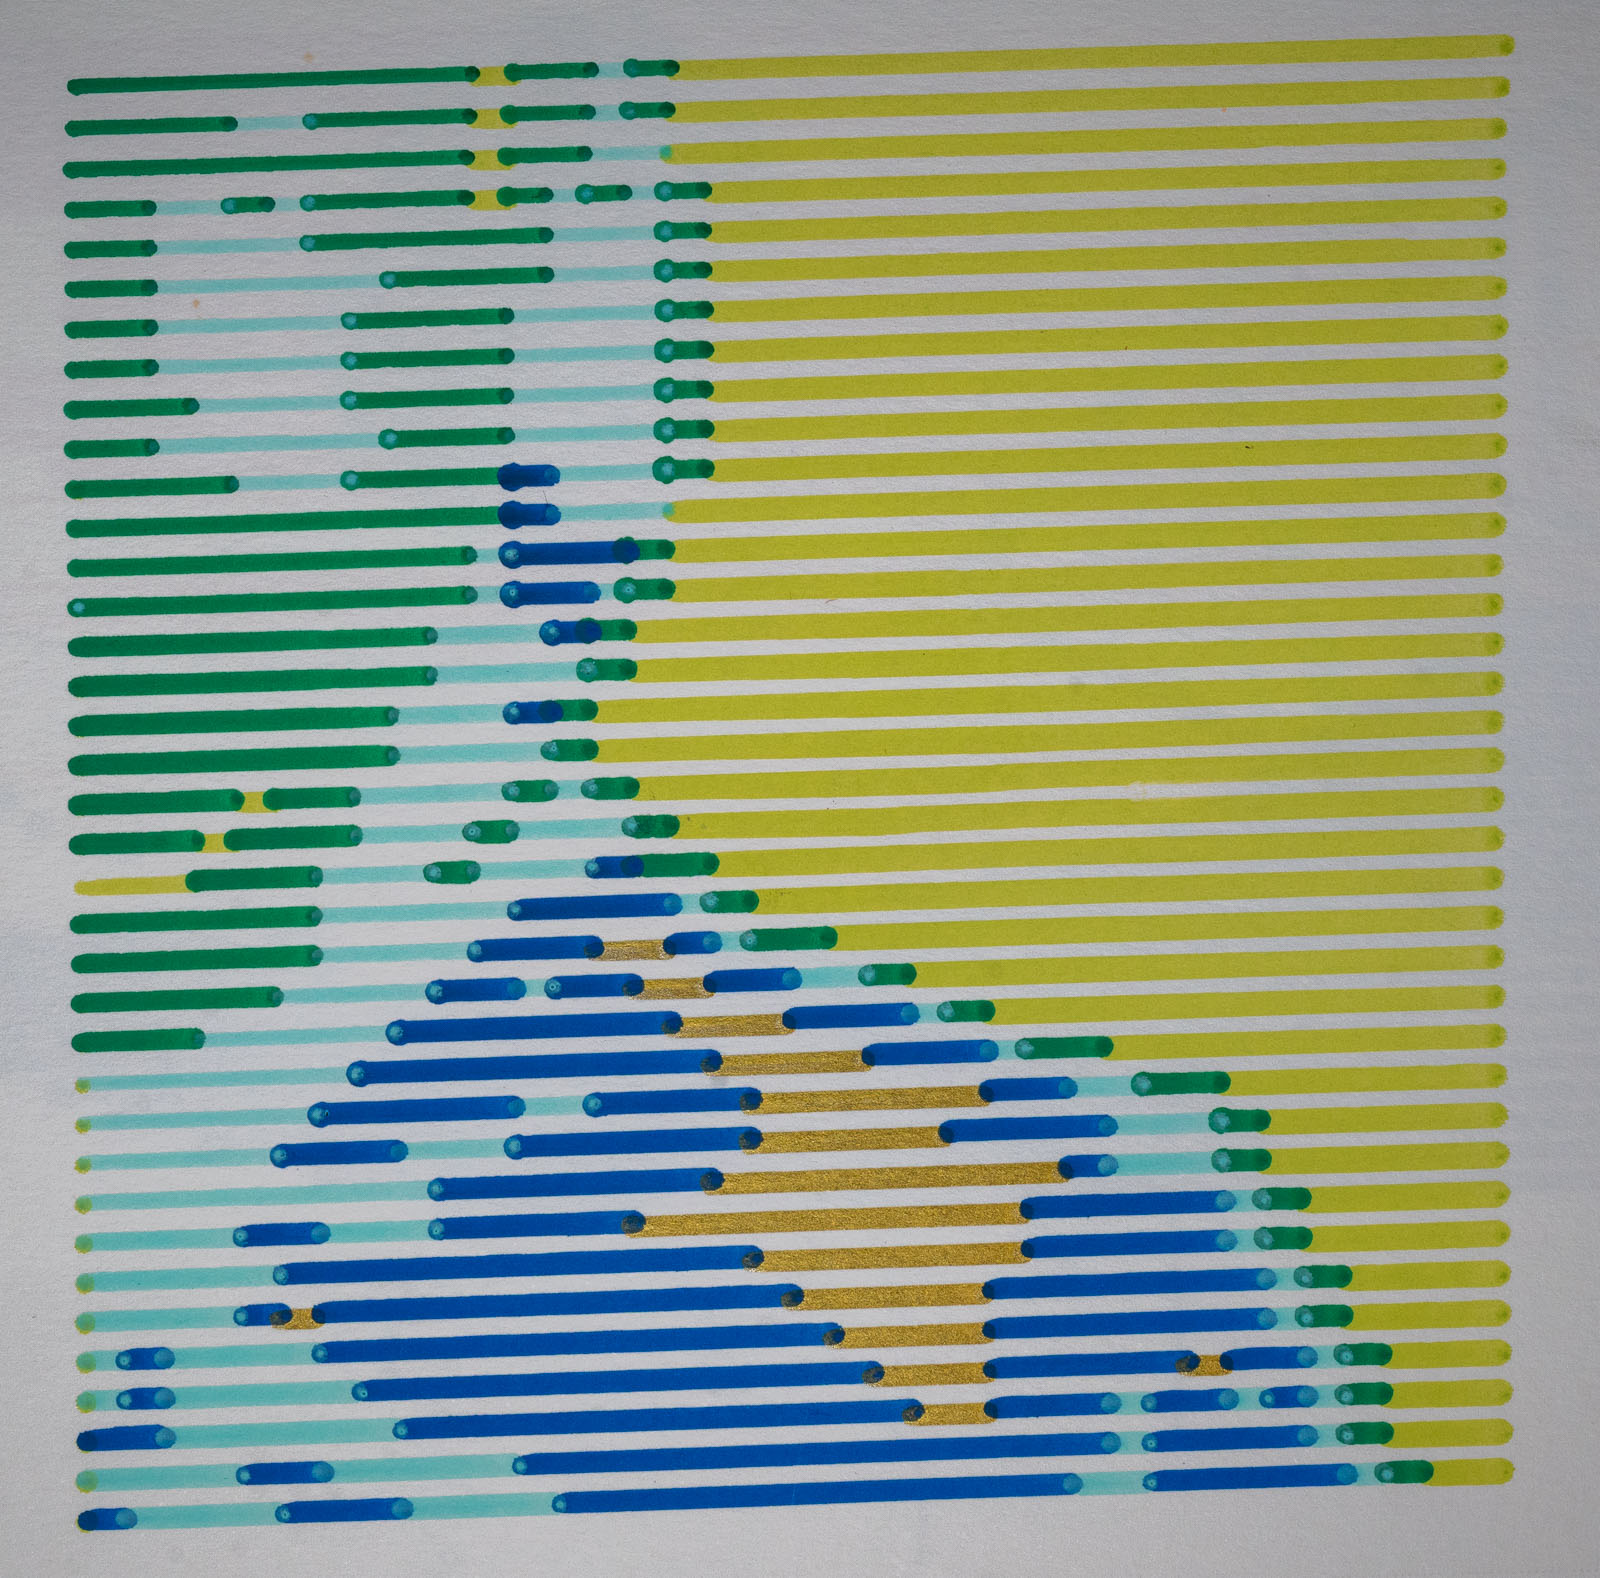
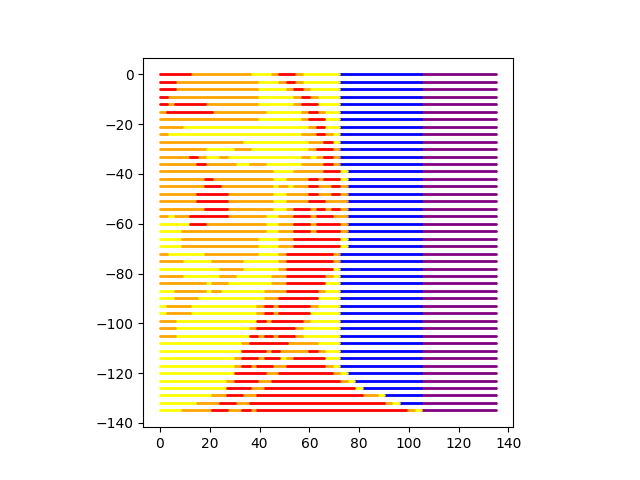
Convert an image into a series of parallel lines where each line is one of N colors.
Images


Plotter Preview

Code
from gcode2dplotterart import Plotter2D
import cv2
import numpy as np
from imutils import resize
from math import floor
from typing import List

"""
Preface - numpy and cv2 are still a bit alien to me. The code here could be done better.

1. Take in an image.
2. Grayscale all of the pixels so that each pixel is represented by a number from 0 to 255.
3. Bucket the pixels such that
  - 0 -> A   becomes 0
  - A -> B   becomes 1
  - B -> C   becomes 2
  - C -> 255 becomes 3
4. Start with the first row of pixels.
5. Add the first point to a new path and move to the next pixel.
6. If the current pixel is the same as the previous pixel, append the point to the path and repeat, otherwise,
    start a new path.
7. Continue until all points of all colors are plotted.

Note
- Make sure that the combination of X_SCALE, Y_SCALE, and the resized image aren't too big for the plotter area.

"""

# These numbers can be changed in combination with the image size. Adds a bit of spacing since I use thicker
# pens and they'd overlap.
X_PIXELS_PER_PLOTTER_UNIT = 1 / 3
Y_PIXELS_PER_PLOTTER_UNIT = 1 / 3


def evenly_distribute_pixels_per_color(
    img: cv2.typing.MatLike, n: int
) -> List[List[int]]:
    """
    Ensures that each color has the same number of pixels.

    Arg:
        `img` : cv2.typing.MatLike
            The image to process
        `n` : Number of colors to distribute pixels into

    Returns
    `   img` : List[List[int]]
           Image mapped to n colors
    """

    total_pixels = img.size
    pixel_bins = []
    histogram, bins = np.histogram(img.ravel(), 256, (0, 256))
    count = 0
    for pixel_value, pixel_count in enumerate(histogram):
        if count >= total_pixels / (n):
            count = 0
            pixel_bins.append(pixel_value)
        count += pixel_count

    return np.subtract(np.digitize(img, pixel_bins), 0)


def resize_image_for_plotter(filename: str) -> List[List[int]]:
    img = cv2.imread(filename)
    img = cv2.cvtColor(img, cv2.COLOR_BGR2GRAY)

    # The following math will ensure that the image is scaled to the plotter size and the remaining math
    # throughout the program will work.
    plotter_ratio = "landscape" if plotter.width > plotter.height else "portrait"
    # It appears shape is (columns, rows)
    img_ratio = "landscape" if img.shape[1] > img.shape[0] else "portrait"
    if (
        plotter_ratio == "landscape"
        and img_ratio == "landscape"
        or plotter_ratio == "portrait"
        and img_ratio == "landscape"
    ):
        img = resize(img, width=floor(plotter.width * X_PIXELS_PER_PLOTTER_UNIT))
    elif (
        plotter_ratio == "portrait"
        and img_ratio == "portrait"
        or plotter_ratio == "landscape"
        and img_ratio == "portrait"
    ):
        print("resizing height")
        img = resize(img, height=floor(plotter.height * Y_PIXELS_PER_PLOTTER_UNIT))

    print("resized to ", img.shape)
    return img


plotter = Plotter2D(
    title="Horizontal Line Art",
    x_min=0,
    x_max=200,
    y_min=-140,  # Note - My plotting goes from -150 to 0.
    y_max=0,
    feed_rate=10000,
    output_directory="./output",
    handle_out_of_bounds="Warning",  # It appears that some points end up outside of bounds so scale down.
)

COLOR_LAYERS = [
    "purple",
    "blue",
    "yellow",
    "orange",
    "red",
]
for layer in COLOR_LAYERS:
    plotter.add_layer(layer, color=layer)

input_filename = "landscape.jpg"

# Works with color PNGs exported from Lightroom and Photoshop. Could learn some more about reading images
resized_image = resize_image_for_plotter(input_filename)
color_reduced_image = evenly_distribute_pixels_per_color(
    resized_image, n=len(COLOR_LAYERS)
)


for y_index, row in enumerate(color_reduced_image):
    y_plotter_scale = (
        y_index / Y_PIXELS_PER_PLOTTER_UNIT * -1
    )  # My plotter goes y=-150 to y=0, therefore numbers are negative. Probably a better solution.
    line_start = [0, y_plotter_scale]
    line_end = None
    current_color_value = color_reduced_image[0][y_index]

    for x_index, color_value in enumerate(row):
        x_plotter_scale = x_index / X_PIXELS_PER_PLOTTER_UNIT
        if color_value == current_color_value:
            continue

        line_end = [x_plotter_scale, y_plotter_scale]
        plotter.layers[COLOR_LAYERS[current_color_value]].add_line(
            line_start[0], line_start[1], line_end[0], line_end[1]
        )

        line_start = line_end

        current_color_value = color_value
    line_end = [x_plotter_scale, y_plotter_scale]
    plotter.layers[COLOR_LAYERS[current_color_value]].add_line(
        line_start[0], line_start[1], line_end[0], line_end[1]
    )

plotter.preview()
plotter.save()