2023-11-24 Josef Albers Homage
Description
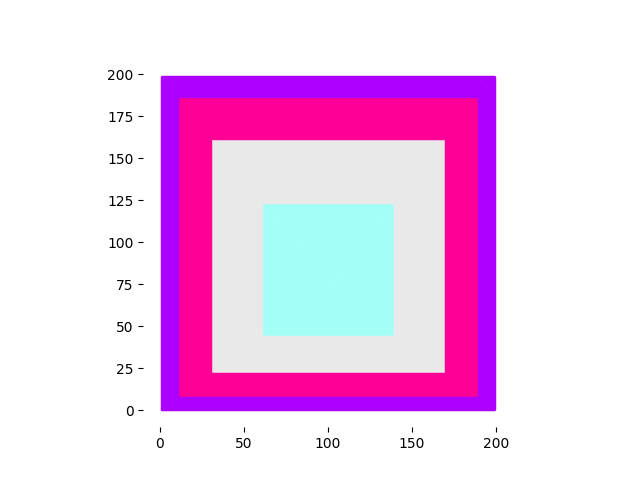
An homage to Josef Albers
Images


Plotter Preview

Code
from gcode2dplotterart import Plotter2D
from random import randrange, shuffle
import math
from typing import Dict, List, Union
import time

LINE_WIDTH = 2.5

COLORS = [
    {"title": "blue1", "color": "#A2FFF8"},
    {"title": "pink2", "color": "#FF0096"},
    {"title": "purple2", "color": "#AD00FF"},
    {"title": "grey1", "color": "#E9E9E9"},
]

plotter = Plotter2D(
    title="Josef Albers Homage",
    x_min=0,
    x_max=200,
    y_min=0,
    y_max=200,
    feed_rate=10000,
)

shuffle(COLORS)
color_choices = COLORS[0:4]

for color in color_choices:
    plotter.add_layer(
        title=color["title"],
        color=color["color"],
        line_width=LINE_WIDTH,
    )

SIDE_PADDING = int(plotter.width * 0.2)

x_center = (plotter.x_max - plotter.x_min) / 2
y_center = randrange(
    int(plotter.y_min) + SIDE_PADDING, int(plotter.y_max) - SIDE_PADDING
)

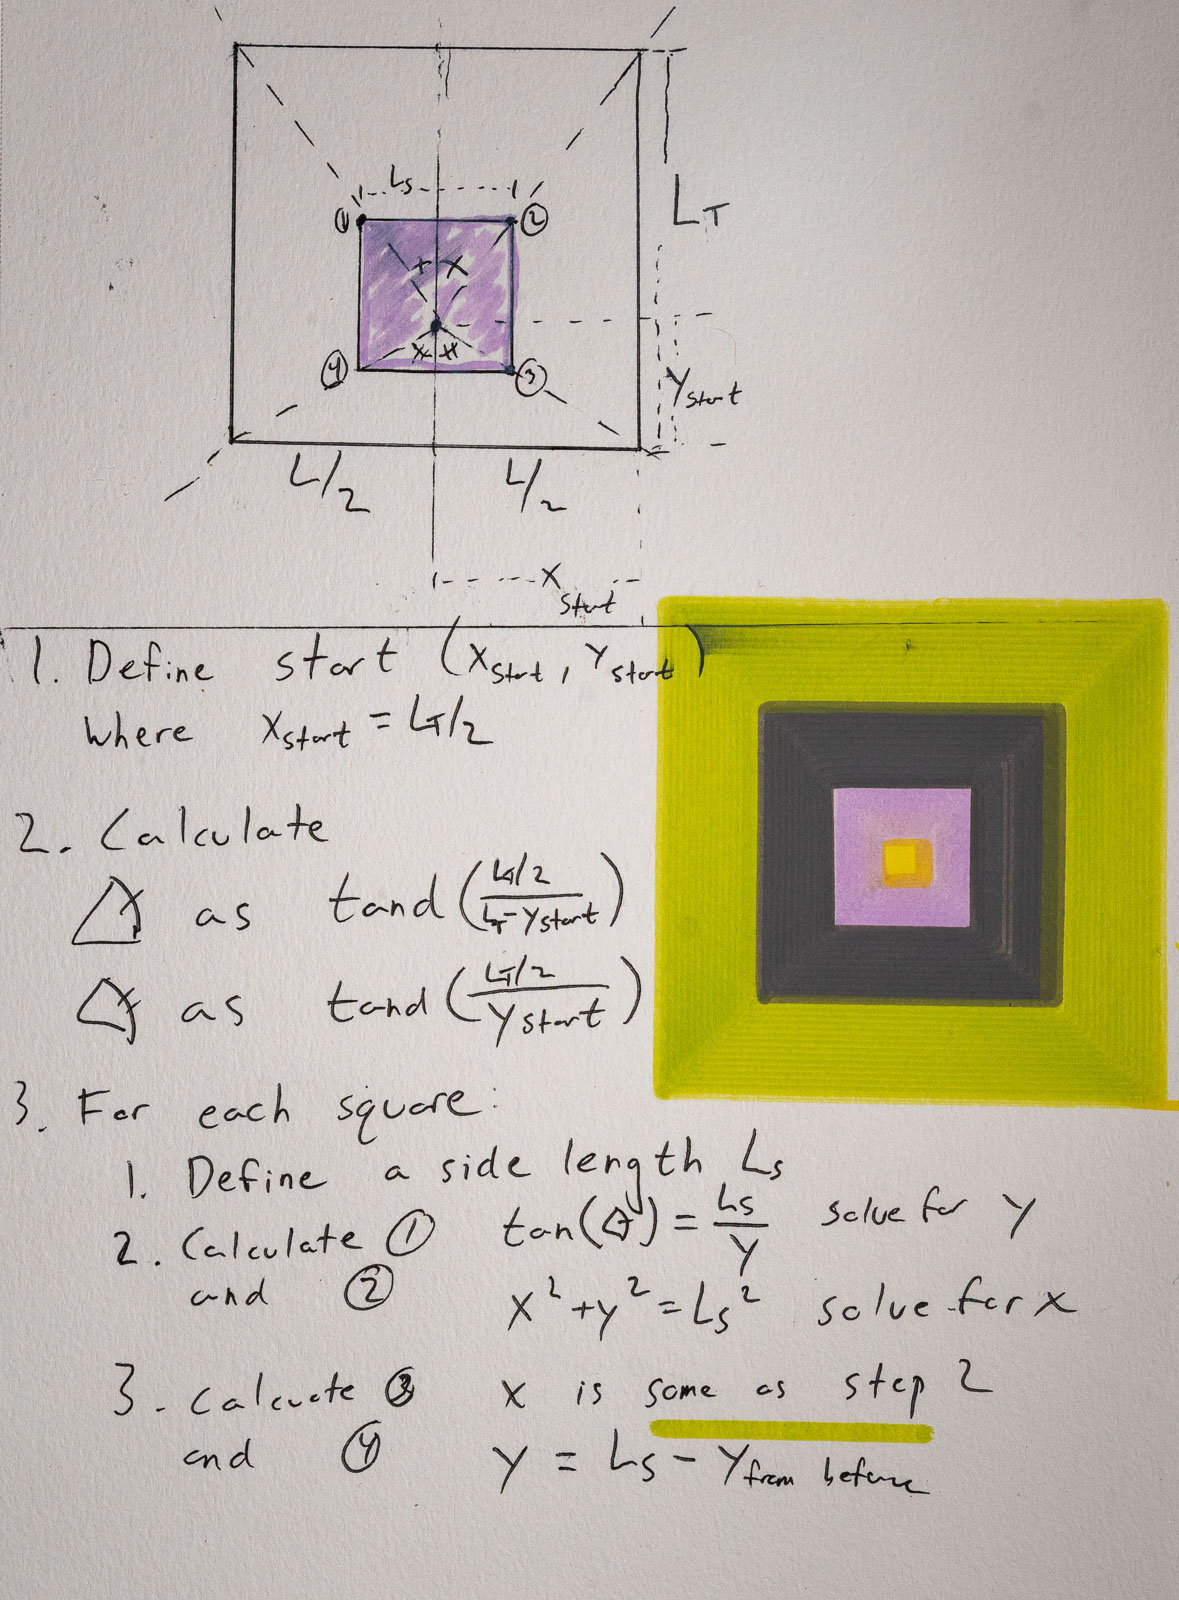
vertical_angle = math.degrees(math.atan(int(plotter.width / 2) / (y_center)))

square_side_length_percentages = [0.4, 0.7, 0.9, 1]

square_side_lengths = [
    int(plotter.width * percentage) for percentage in square_side_length_percentages
]
sorted(square_side_lengths)

current_side_length = LINE_WIDTH
for index, color in enumerate(color_choices):
    threshold_side_length = square_side_lengths[index]

    while current_side_length < threshold_side_length:
        x_left_of_center = current_side_length / 2
        y_below_center = x_left_of_center / math.tan(math.radians(vertical_angle))

        x_start = x_center - x_left_of_center
        y_start = y_center - y_below_center

        x_end = x_start + current_side_length
        y_end = y_start + current_side_length

        plotter.layers[color["title"]].add_rectangle(
            x_start=x_start,
            y_start=y_start,
            x_end=x_end,
            y_end=y_end,
        )

        current_side_length += LINE_WIDTH

plotter.preview()
plotter.save()