2023-06-20 Sine Waves
Description
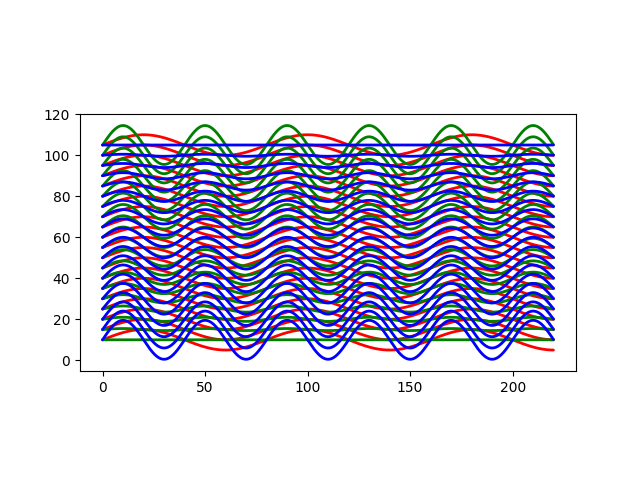
Series of sine waves plotted with increasing amplitude
Images

Plotter Preview
Code
warning
This code may or may not run and is intended more as a reference. Additionally, it was most likely not written with the latest version of the library. To ensure compatibility, check the date of this post against the version history and install the corresponding version.
import math
from gcode2dplotterart import Plotter2D

magic_mark_eraser = "magic_marker_eraser"
color1 = "color1"
color2 = "color2"

plotter = Plotter2D(
    title="Sine Waves",
    x_min=0,
    x_max=220,
    y_min=0,
    y_max=150,
    feed_rate=10000,
    output_directory="./output",
    handle_out_of_bounds="Warning",
)

plotter.add_layer(magic_mark_eraser, color="red")
plotter.add_layer(color1, color="green")
plotter.add_layer(color2, color="blue")


def plot_sine_wave(y_offset, amplitude, wavelength):
    path = []
    scale_up = 10
    scale_down = 1 / scale_up

    for step in range(plotter.x_min * scale_up, plotter.x_max * scale_up):
        x = step * scale_down
        y = amplitude * math.sin((2 * math.pi * x) / wavelength)
        y += y_offset
        path.append((x, y))

    return path


OFFSETS = [i for i in range(10, 110, 5)]

for index, i in enumerate(OFFSETS):
    path = plot_sine_wave(y_offset=i, amplitude=index / 2, wavelength=40)
    plotter.layers[color1].add_path(path)

for index, i in enumerate(reversed(OFFSETS)):
    path = plot_sine_wave(y_offset=i, amplitude=index / 2, wavelength=40)
    plotter.layers[color2].add_path(path)

for index, i in enumerate(OFFSETS):
    path = plot_sine_wave(y_offset=i, amplitude=5, wavelength=80)
    plotter.layers[magic_mark_eraser].add_path(path)


plotter.preview()
plotter.save()