2023-11-28 Josef Albers Recursive Homage
Description
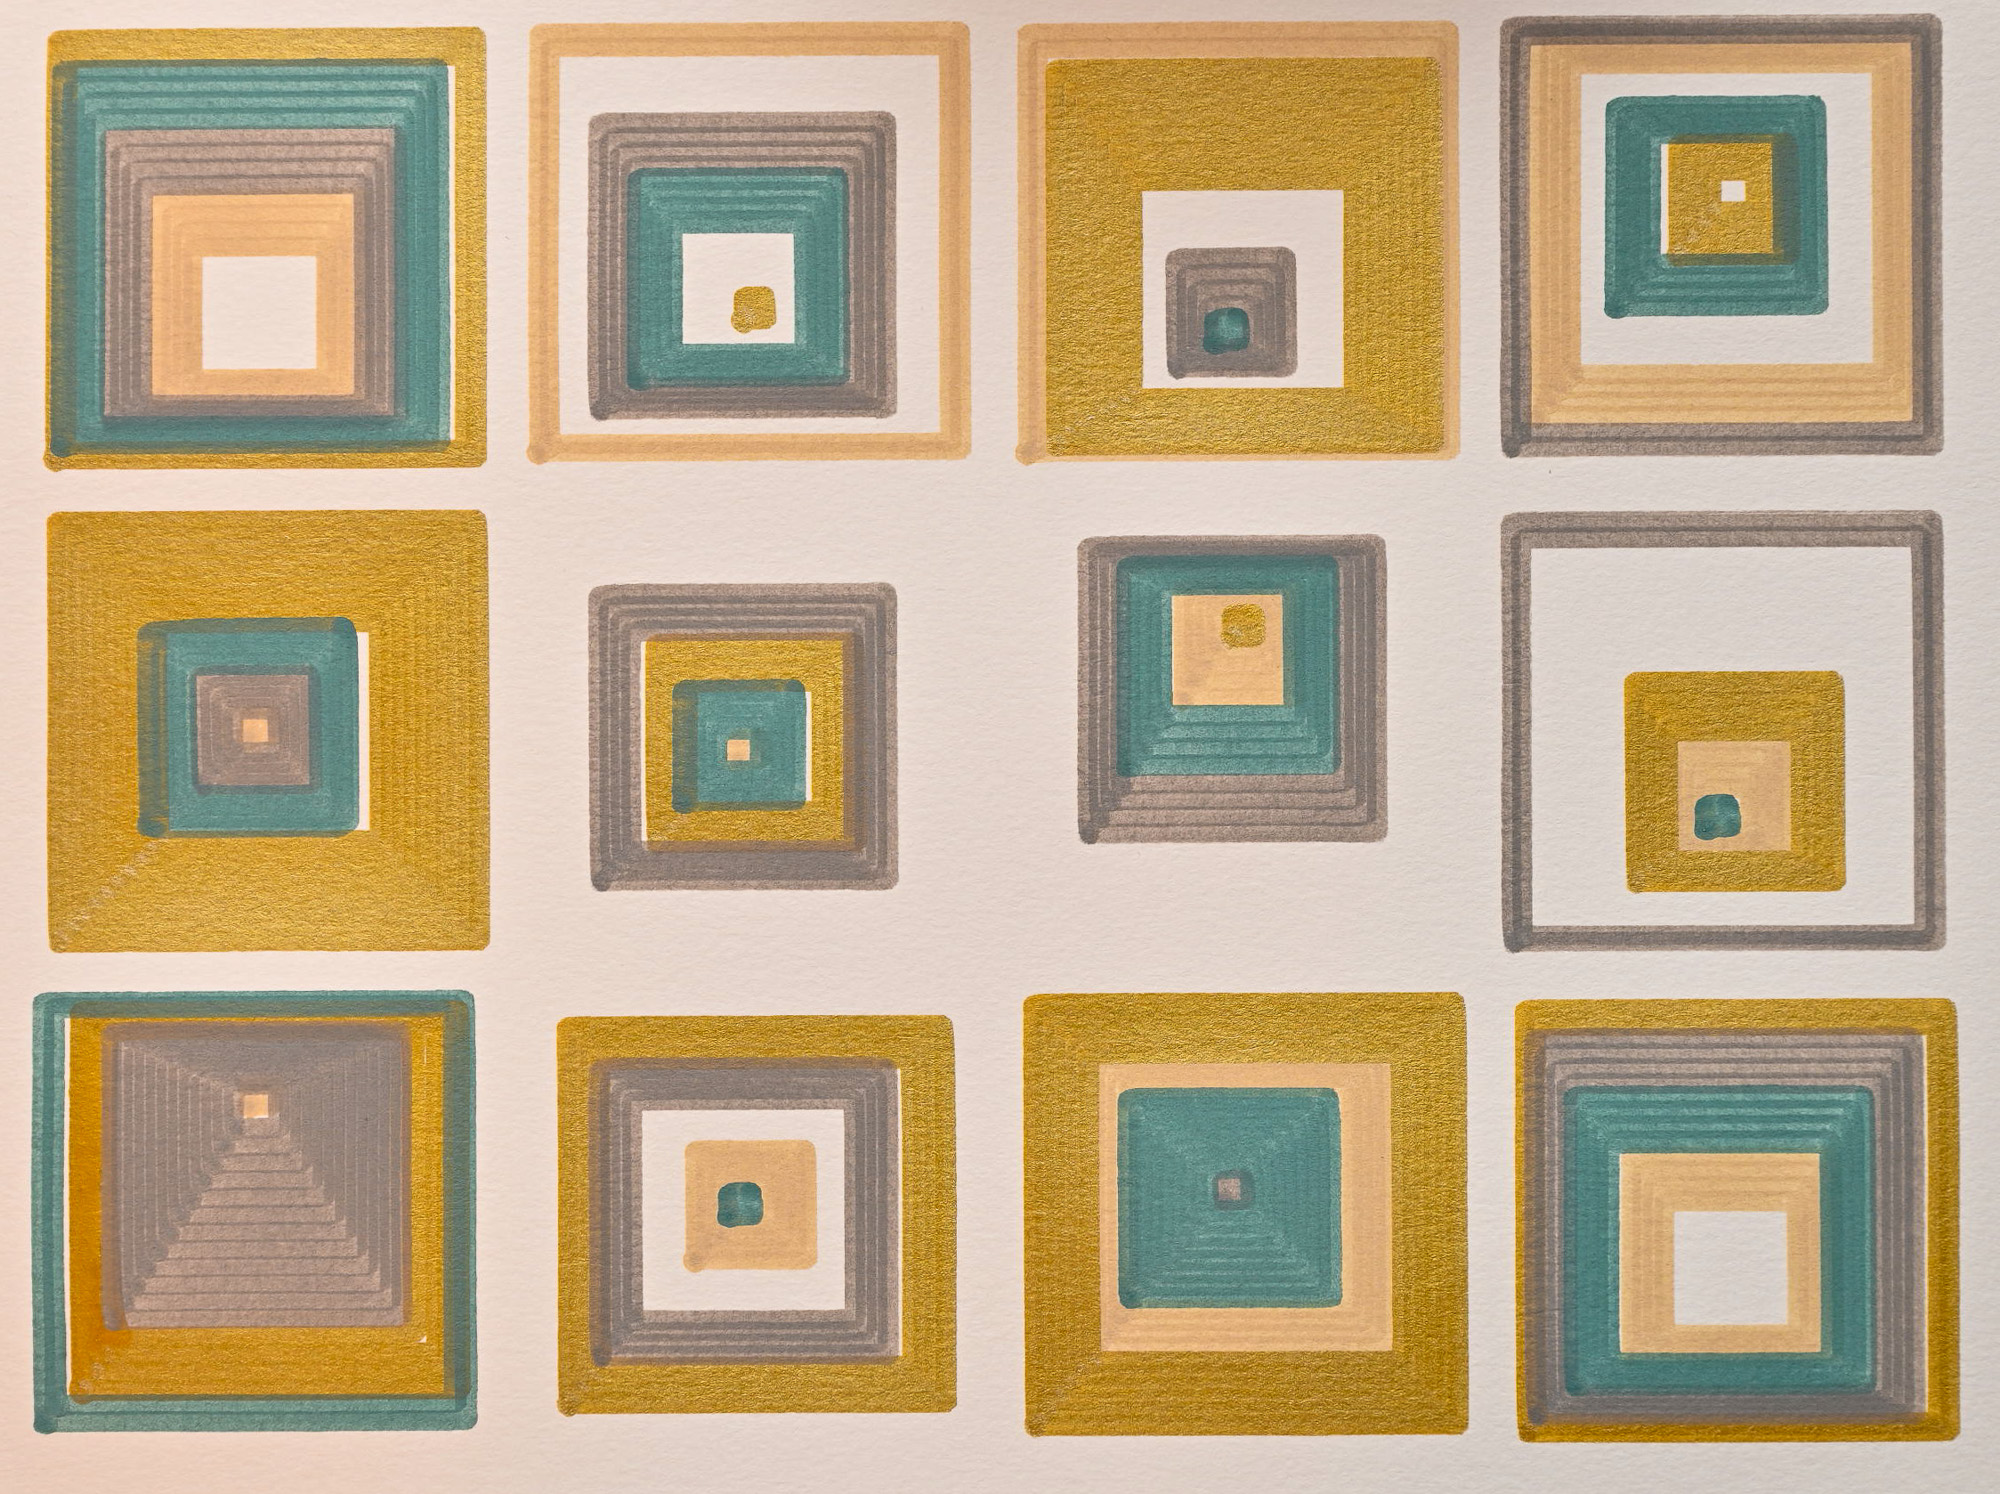
An homage to Josef Albers, recursively.
Images
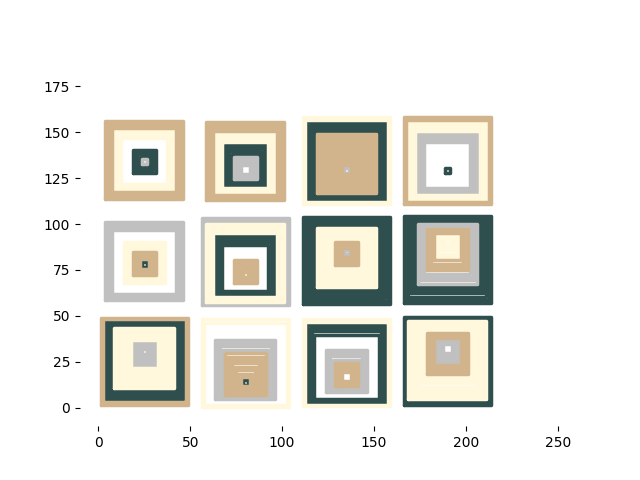
Plotter Preview
Code
warning
This code may or may not run and is intended more as a reference. Additionally, it was most likely not written with the latest version of the library. To ensure compatibility, check the date of this post against the version history and install the corresponding version.
from gcode2dplotterart import Plotter2D
from random import randrange, shuffle
import math


LINE_WIDTH = 2.5

COLORS = [
    {"title": "color1", "color": "darkslategrey"},
    {"title": "color2", "color": "silver"},
    {"title": "color3", "color": "cornsilk"},
    {"title": "color4", "color": "tan"},
]

plotter = Plotter2D(
    title="Josef Albers Homage",
    x_min=0,
    x_max=250,
    y_min=0,
    y_max=180,
    feed_rate=10000,
)

DONT_PLOT_LAYER = {
    "title": "DONT PLOT",
    "color": "#FFFFFF",
    "line_width": LINE_WIDTH,
}
plotter.add_layer(**DONT_PLOT_LAYER)

for color in COLORS:
    plotter.add_layer(
        title=color["title"],
        color=color["color"],
        line_width=LINE_WIDTH,
    )

# Should be less than 100 so that the last square can be one later on.
SIDE_LENGTH_PERCENTAGE_CHOICES = [i / 100 for i in range(10, 99, 20)]


def josef_albers(x_min: float, y_min: float, side_length: float):
    colors = COLORS.copy()

    # Append some number of white layers.
    for i in range(randrange(0, 3)):
        colors.append(DONT_PLOT_LAYER)

    shuffle(colors)

    side_padding = LINE_WIDTH * 5
    x_center = x_min + side_length / 2
    y_center = randrange(
        int(y_min + side_padding), int(y_min + side_length - side_padding)
    )

    vertical_angle = math.degrees(math.atan(int(side_length / 2) / (y_center - y_min)))

    shuffle(SIDE_LENGTH_PERCENTAGE_CHOICES)
    square_side_length_percentages = SIDE_LENGTH_PERCENTAGE_CHOICES[: len(colors) - 1]
    square_side_length_percentages.append(1)

    square_side_lengths = sorted(
        [int(side_length * percentage) for percentage in square_side_length_percentages]
    )

    current_side_length = LINE_WIDTH
    for index, color in enumerate(colors):
        threshold_side_length = square_side_lengths[index]

        while current_side_length < threshold_side_length:
            x_left_of_center = current_side_length / 2
            y_below_center = x_left_of_center / math.tan(math.radians(vertical_angle))
            x_start = x_center - x_left_of_center
            y_start = y_center - y_below_center

            x_end = x_start + current_side_length
            y_end = y_start + current_side_length

            plotter.layers[color["title"]].add_rectangle(
                x_start=x_start,
                y_start=y_start,
                x_end=x_end,
                y_end=y_end,
            )

            current_side_length += LINE_WIDTH


SIDE_LENGTH = 50

for x in range(0, plotter.width - SIDE_LENGTH, SIDE_LENGTH + 5):
    for y in range(0, plotter.height - SIDE_LENGTH, SIDE_LENGTH + 5):
        josef_albers(x, y, SIDE_LENGTH)

plotter.preview()
plotter.save()