2025-02-06 Cascading Triangles
Description
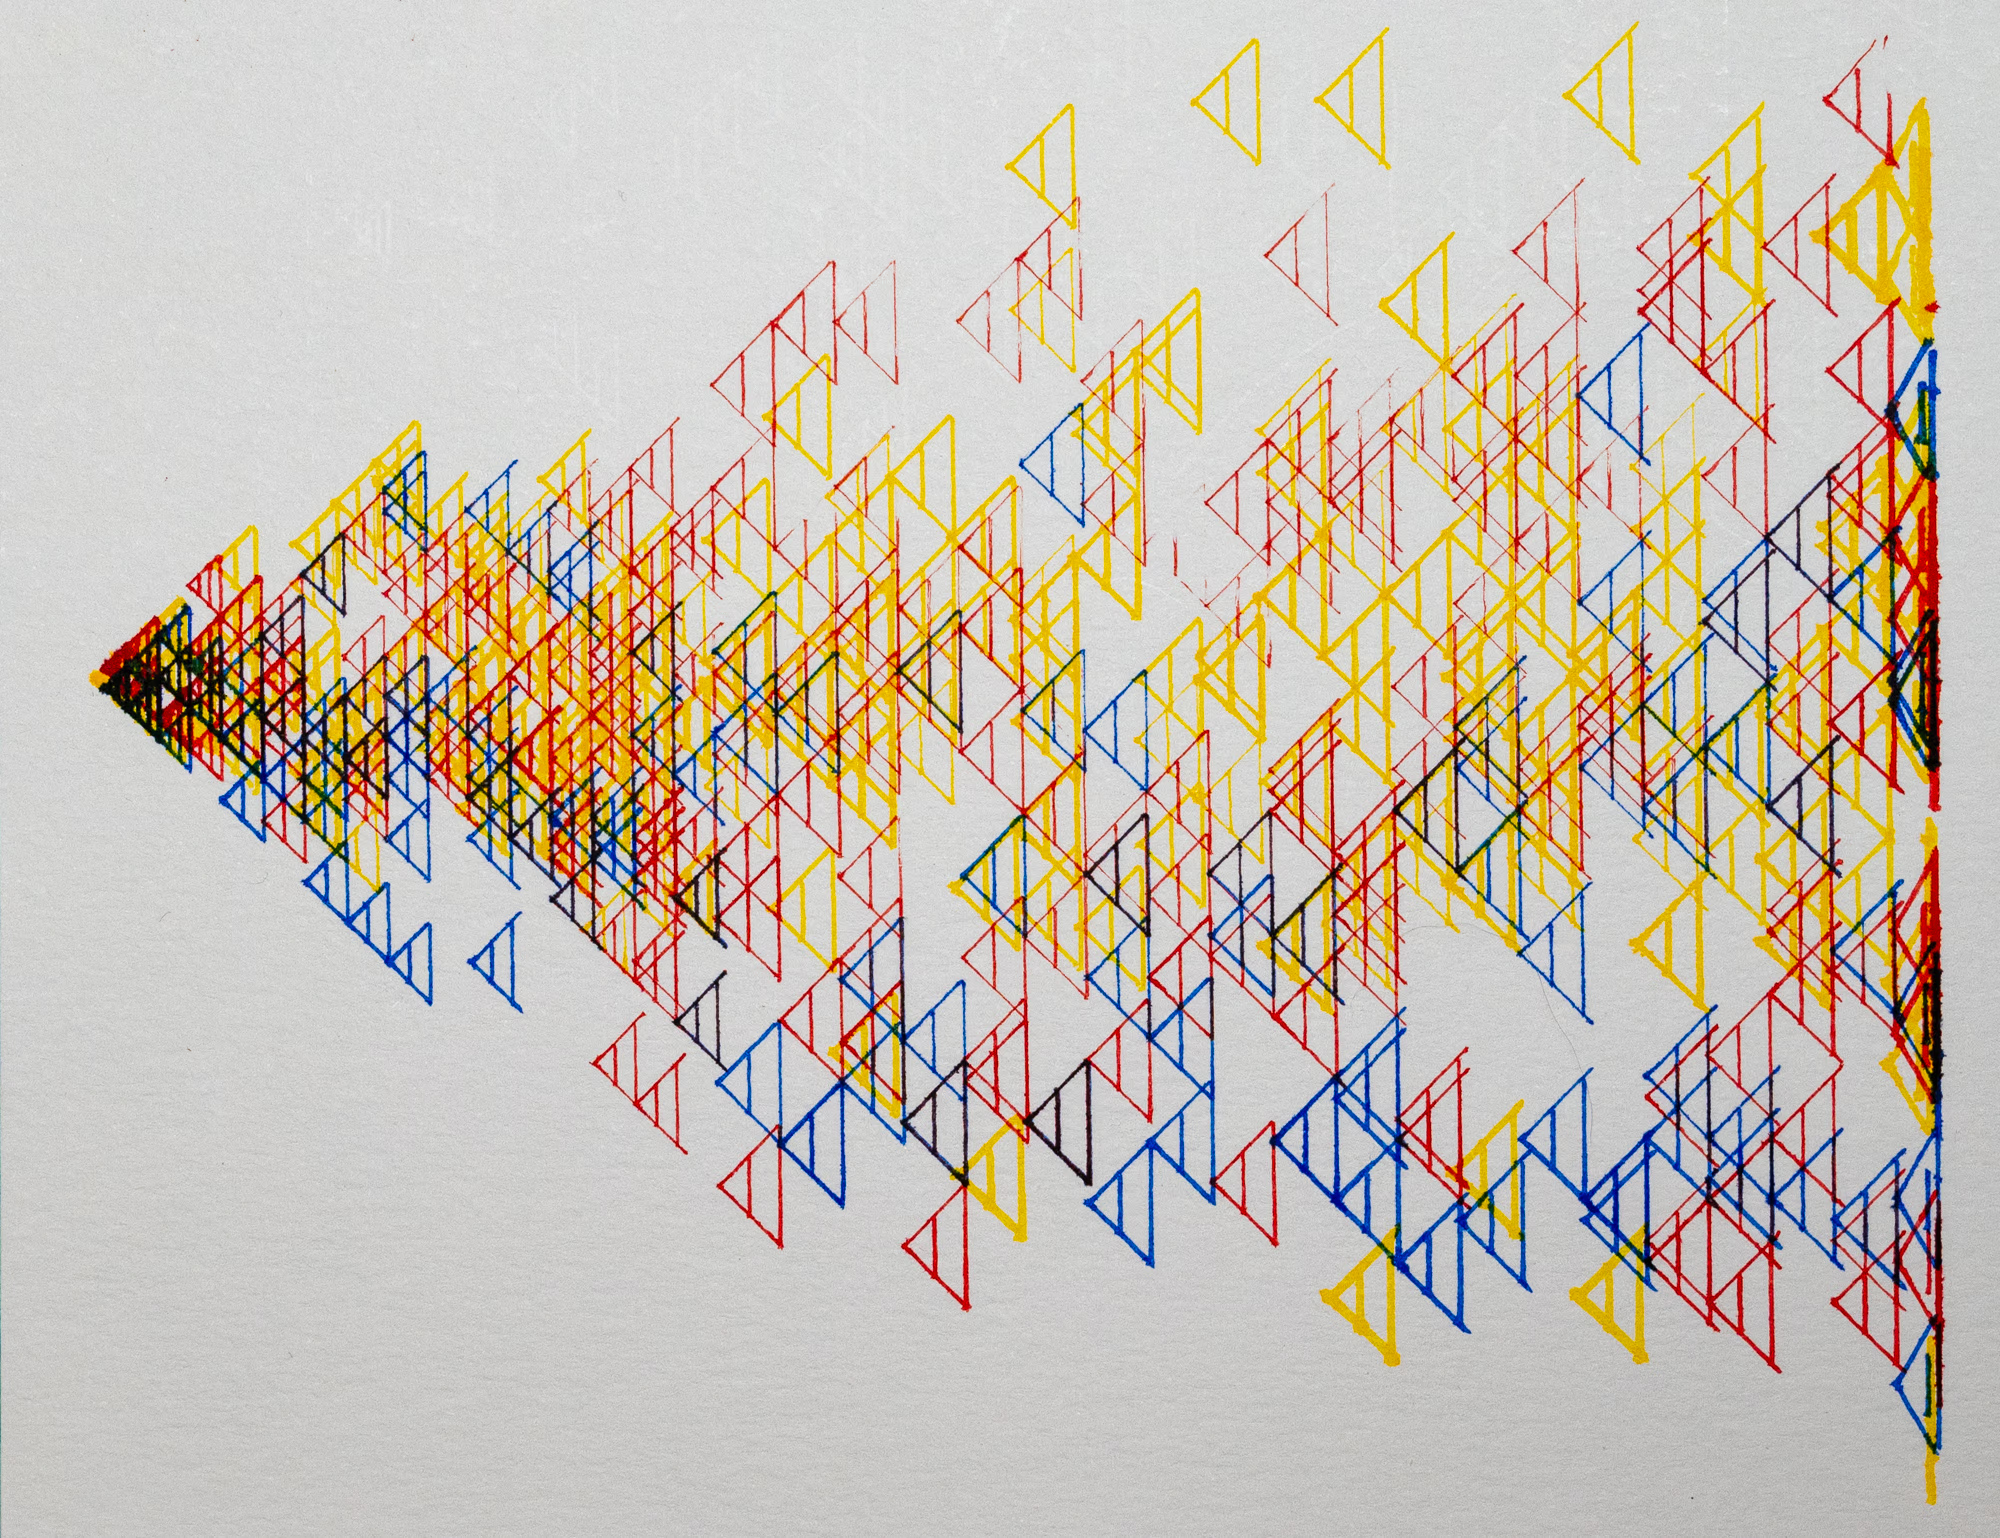
Triangles all from the same origin, moving consistently to the right but randomly up or down.
Images
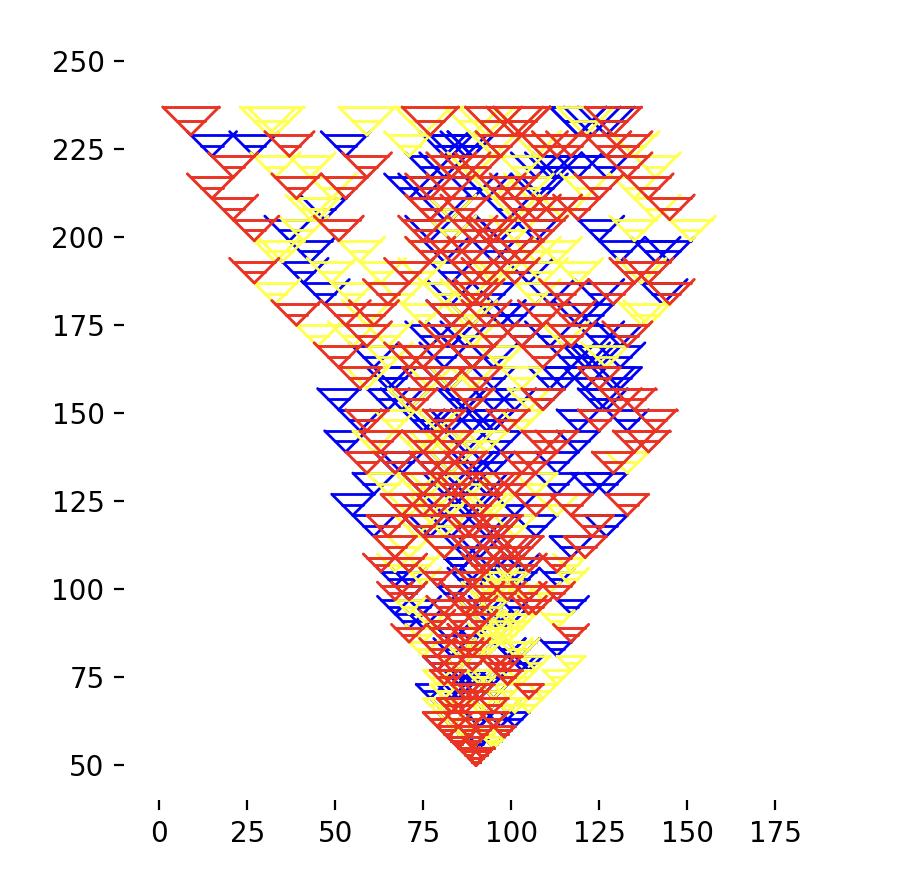
Plotter Preview
Code
warning
This code may or may not run and is intended more as a reference. Additionally, it was most likely not written with the latest version of the library. To ensure compatibility, check the date of this post against the version history and install the corresponding version.
from gcode2dplotterart import Plotter3D
import random
COLORS = [
    {
        "title": "blue",
        "color": "#0000FF",
        "line_width": 1.0,
    },
    {
        "title": "yellow",
        "color": "#FFFF00",
        "line_width": 1.0,
    },
    {
        "title": "red",
        "color": "#FF0000",
        "line_width": 1.0,
    },
]

X_MIN = 0
X_MAX = 180
Y_MIN = 50
Y_MAX = 240
Z_PLOTTING_HEIGHT = 0
Z_NAVIGATION_HEIGHT = 4

# Initialize the plotter
plotter = Plotter3D(
    title="Generative Triangles",
    x_min=X_MIN,
    x_max=X_MAX,
    y_min=Y_MIN,
    y_max=Y_MAX,
    z_plotting_height=Z_PLOTTING_HEIGHT,
    z_navigation_height=Z_NAVIGATION_HEIGHT,
    feed_rate=10_000,  # Default feed rate
    output_directory="./output",
    handle_out_of_bounds="Warning",  # Warn if points are out of bounds
)

for color in COLORS:
    plotter.add_layer(
        title=color["title"],
        color=color["color"],
        line_width=1.0,
    )


def calculate_slope(start, end):
    return (end[1] - start[1]) / (end[0] - start[0])

def equation_of_a_line(start, end, x):
    return calculate_slope(start, end) * (x - start[0]) + start[1]

def in_plotting_area(point):
    return X_MIN <= point[0] <= X_MAX and Y_MIN <= point[1] <= Y_MAX

def plot_cluster(start, side_length):
    end_1 = (start[0] + side_length, start[1] + side_length)
    end_2 = (start[0] - side_length, start[1] + side_length)
    random_color = random.choice(COLORS)
    plotter.layers[random_color["title"]].add_line(X_MIN + start[0], start[1], X_MIN + end_1[0], end_1[1])
    plotter.layers[random_color["title"]].add_line(X_MIN + start[0], start[1], X_MIN + end_2[0], end_2[1])

    for i in range(0, side_length + 1, side_length // 2):
        x1 = start[0] + i
        x2 = start[0] - i
        y1 = equation_of_a_line(start, end_1, x1)
        y2 = equation_of_a_line(start, end_2, x2)

        plotter.layers[random_color["title"]].add_line(x1, y1, x2, y2)

    available_points = [(x1, y1), (x2, y2)]
    available_points = [point for point in available_points if in_plotting_area(point)]
    if len(available_points) == 0:
        return []

    return [random.choice(available_points)]

def main(start):
    counter = 0
    points_seen = set()
    points = [start]
    side_length = 2
    layer = 1
    while counter < 48:
        try:
            start = points.pop(0)
        except IndexError:
            print('out of bounds entirely')
            return
        if start in points_seen:
            continue
        points_seen.add(start)
        new_points = plot_cluster(start, side_length)
        points += new_points
        counter += 1
        if counter == layer ** 2:
            print(f'layer {layer}')
            layer += 1
            side_length += 1

for i in range(0, 20):
    main((X_MIN + X_MAX / 2, Y_MIN))

plotter.preview()

plotter.save()