2025-02-14 Circles
Description
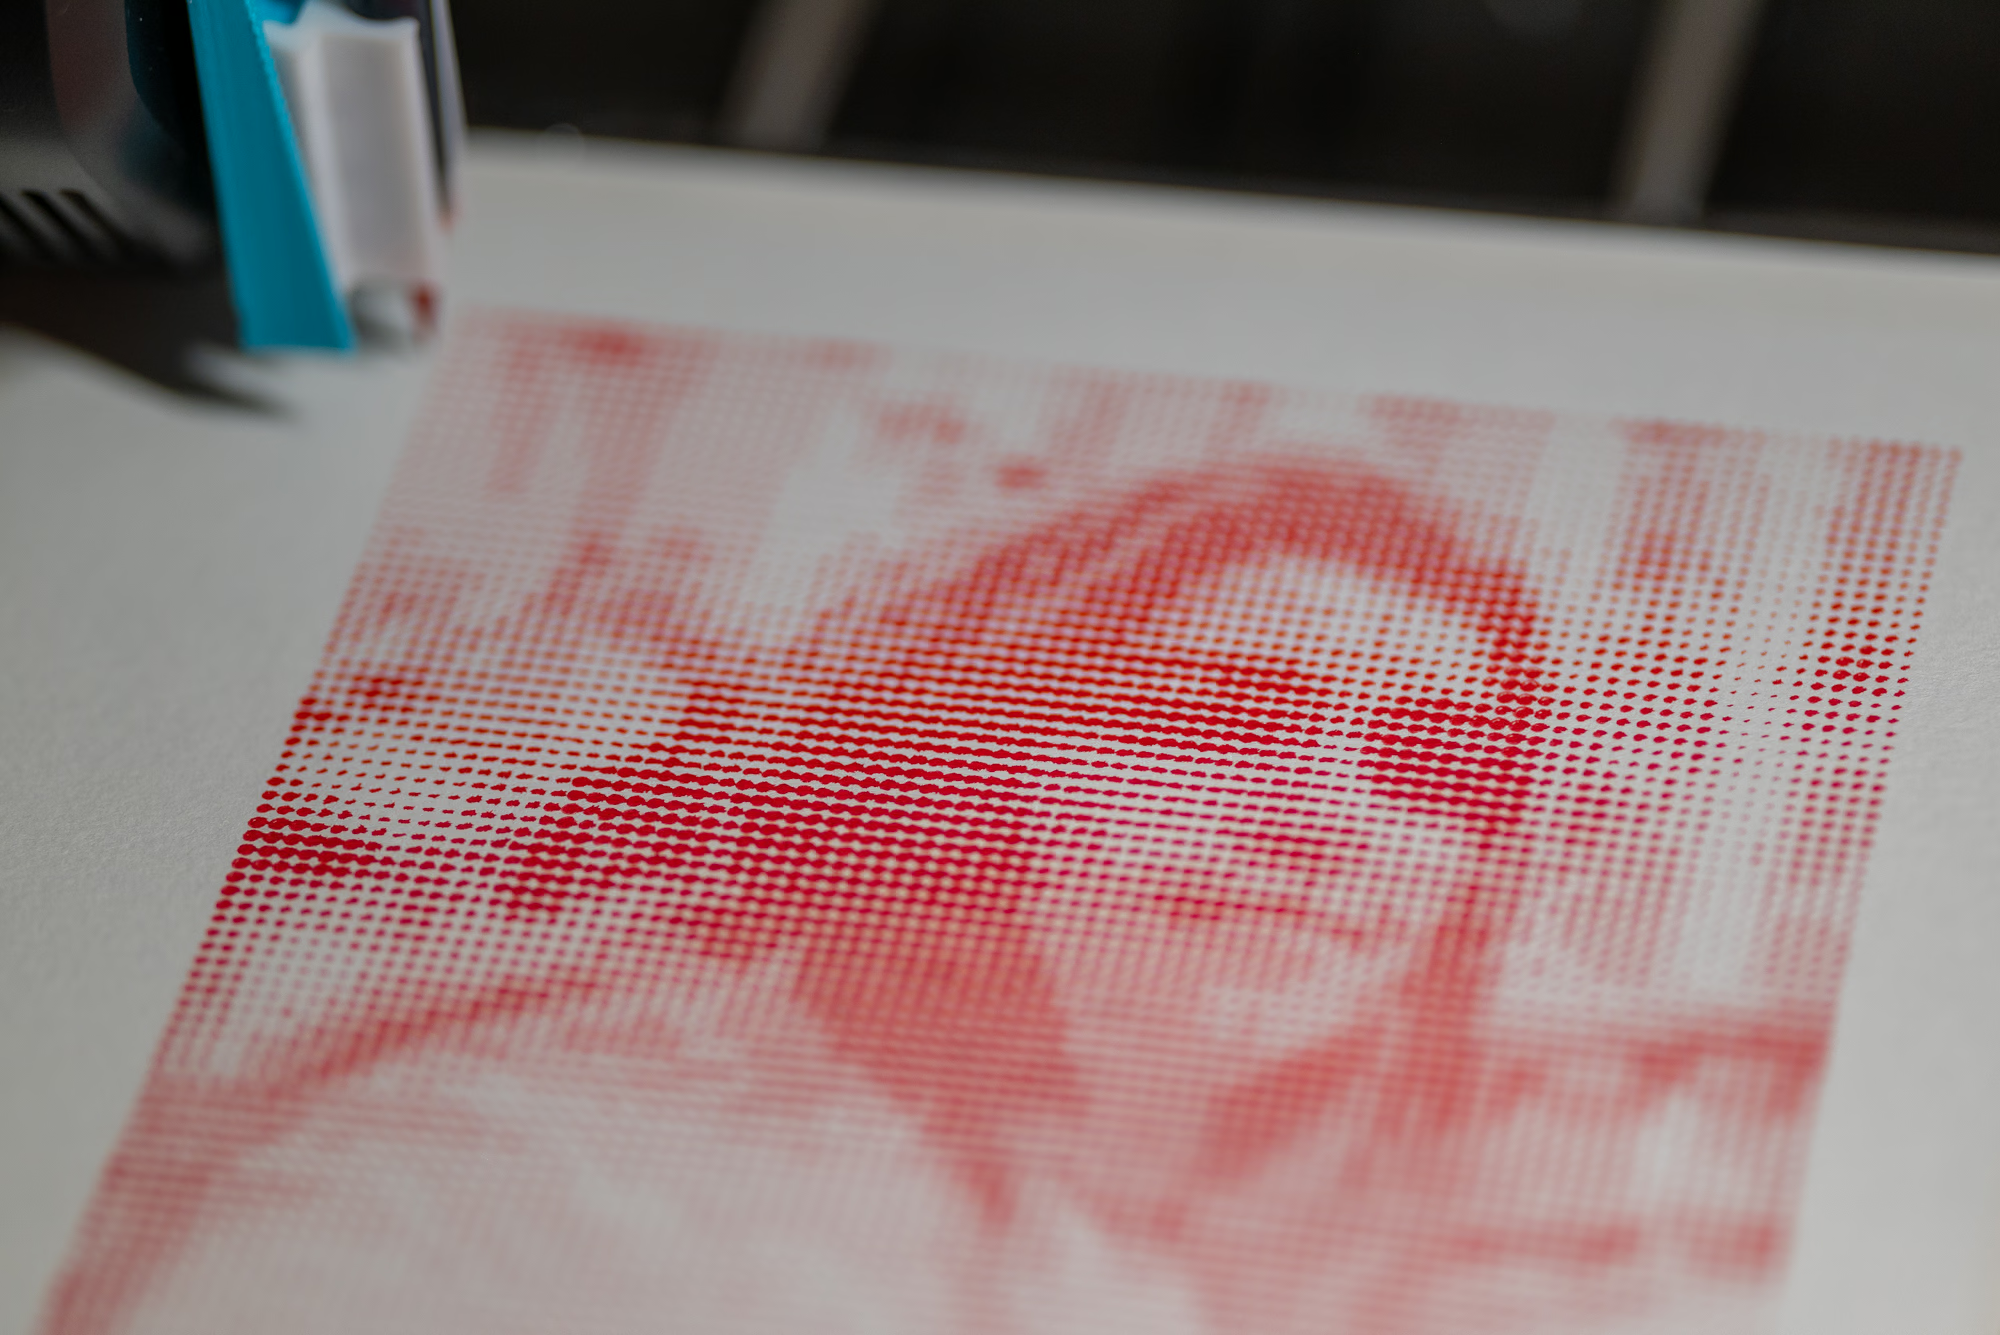
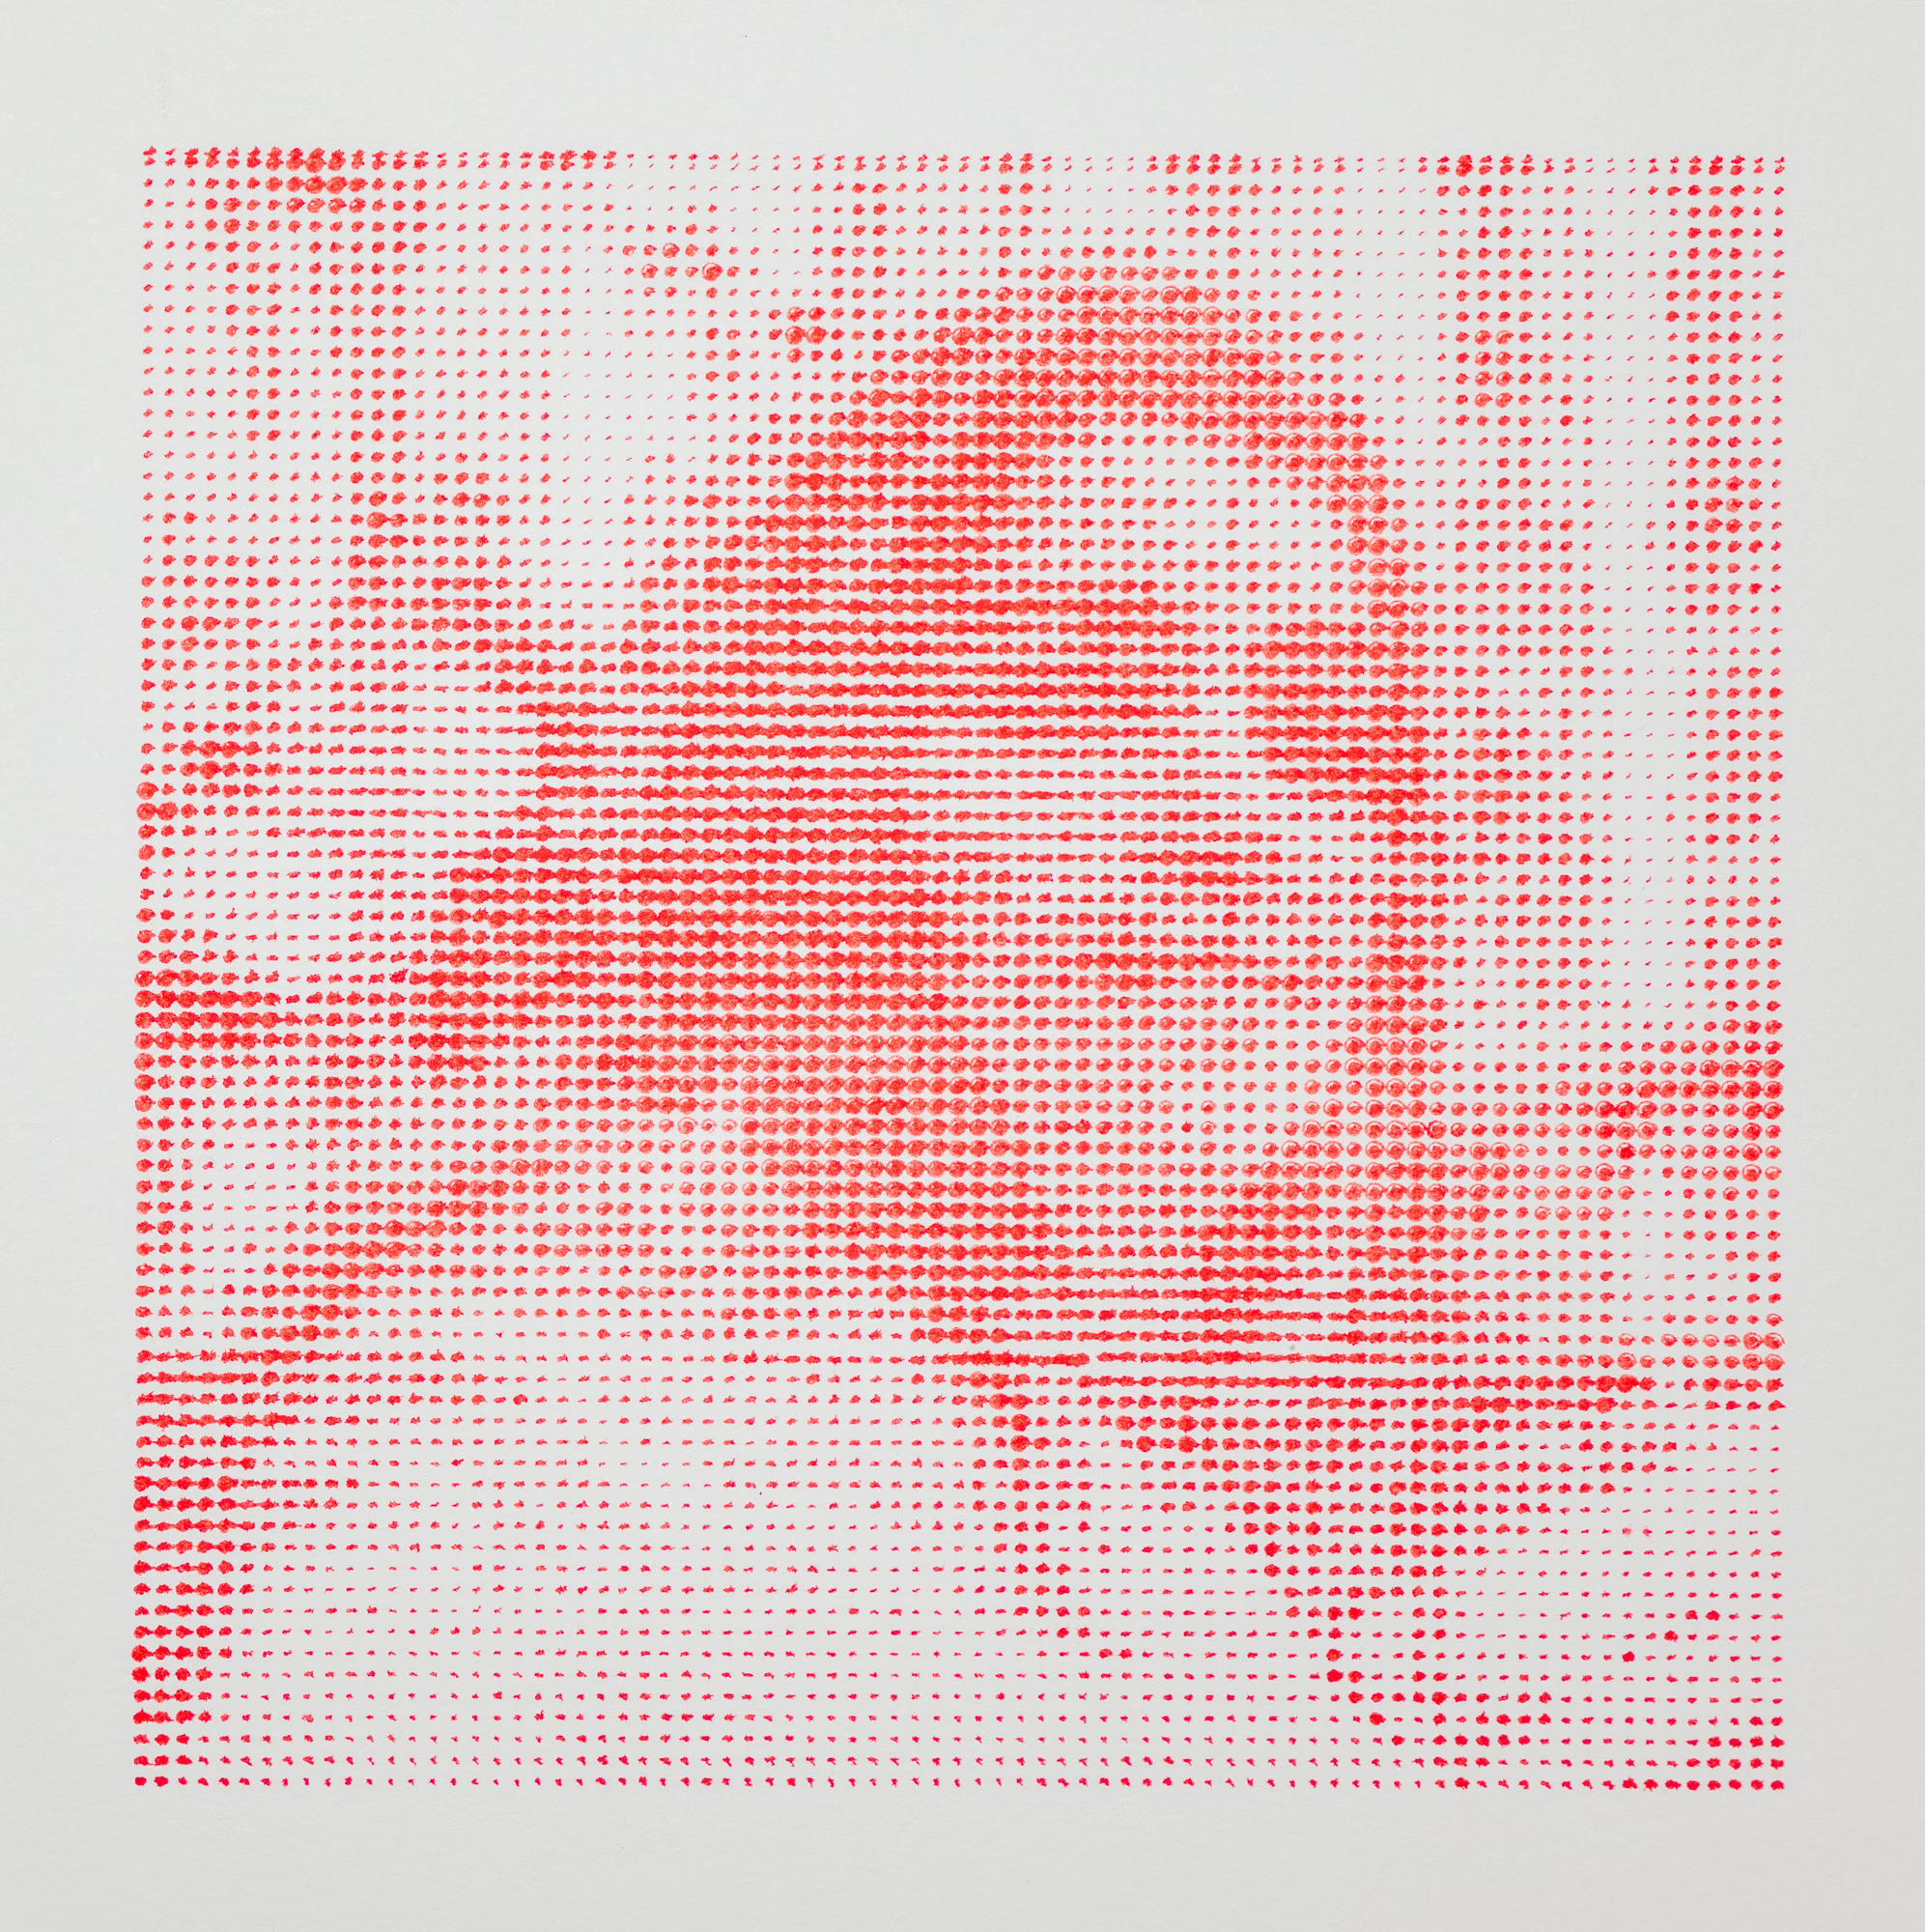
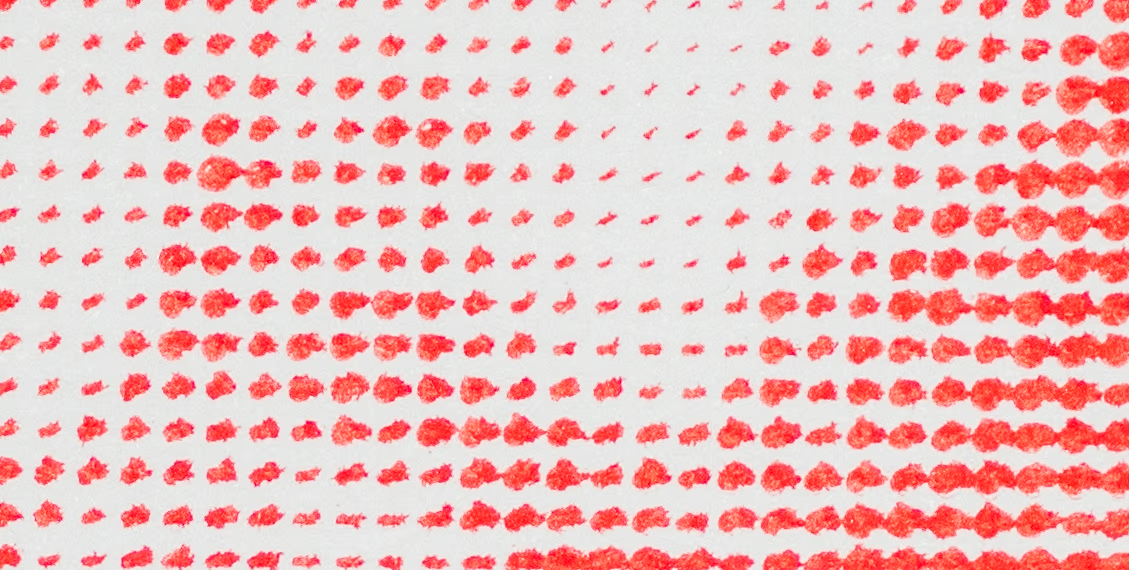
Sample lightness/darkness sections of an image. Use those values to then plot circles of varying diameters.
Images
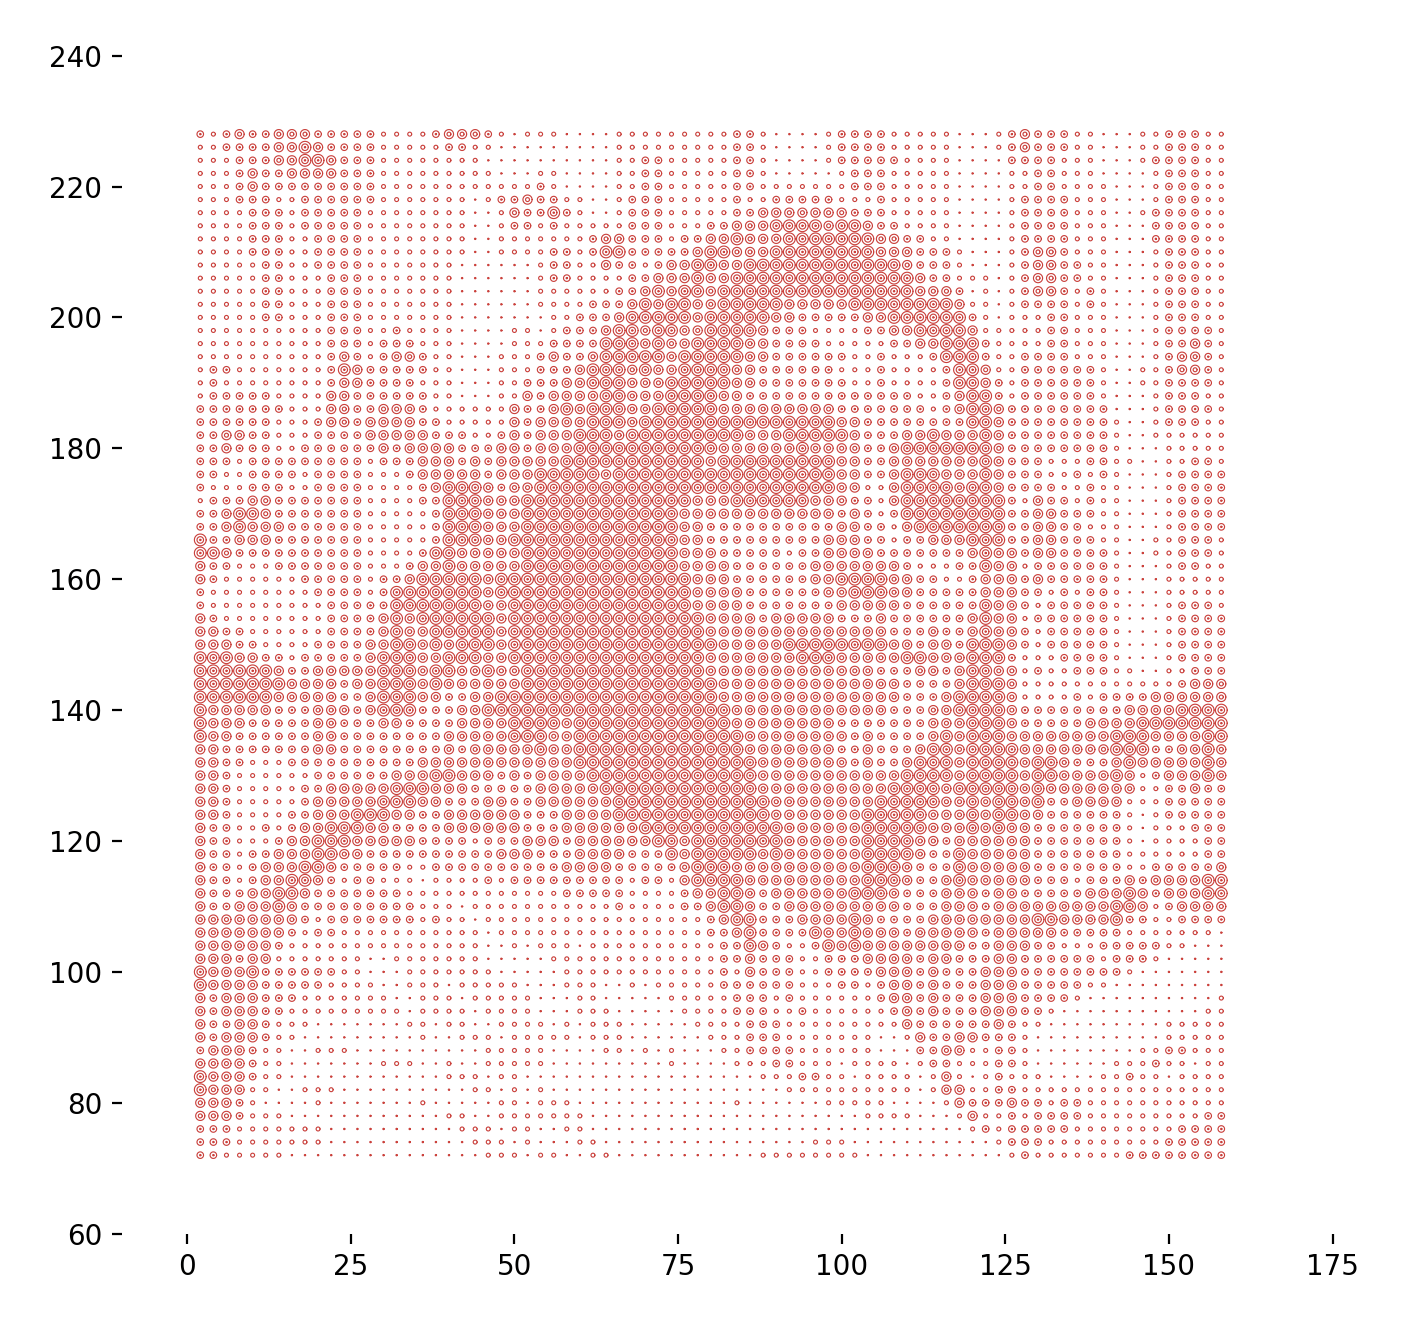
Plotter Preview
Code
warning
This code may or may not run and is intended more as a reference. Additionally, it was most likely not written with the latest version of the library. To ensure compatibility, check the date of this post against the version history and install the corresponding version.
from gcode2dplotterart import Plotter3D
from gcode2dplotterart import experimental_photo_utils

X_MIN = 0
X_MAX = 170
Y_MIN = 70
Y_MAX = 230
Z_PLOTTING_HEIGHT = 0
Z_NAVIGATION_HEIGHT = 1
layer = {
    "title": "red_4",
    "color": "#dd3031",
    "line_width": 0.4,
}

MAX_WIDTH = X_MAX - X_MIN
MAX_HEIGHT = Y_MAX - Y_MIN

# Take in an image, such as size 1000x1000. Sample a 5px square for example,
# which results in 200x200 grid. Then we can draw 200x200 circles at diameter 1 each.#
SAMPLE_LENGTH = 10
OUTPUT_DIAMETER = 2

RADIUS_MAPPING = [
    0.9 * OUTPUT_DIAMETER / 2,
    0.7 * OUTPUT_DIAMETER / 2,
    0.5 * OUTPUT_DIAMETER / 2,
    0.3 * OUTPUT_DIAMETER / 2,
    0.1 * OUTPUT_DIAMETER / 2
]


plotter = Plotter3D(
    title="Circles",
    x_min=X_MIN,
    x_max=X_MAX,
    y_min=Y_MIN,
    y_max=Y_MAX,
    z_plotting_height=Z_PLOTTING_HEIGHT,
    z_navigation_height=Z_NAVIGATION_HEIGHT,
    feed_rate=10_000,
    output_directory="./output",
    handle_out_of_bounds="Warning",
)

plotter.add_layer(
    layer["title"], color=layer["color"], line_width=layer["line_width"]
)

image_path = "./1.jpg"

image = experimental_photo_utils.load_image(image_path)

# Calculate number of circles that will fit in each dimension
circles_width = MAX_WIDTH / OUTPUT_DIAMETER
circles_height = MAX_HEIGHT / OUTPUT_DIAMETER

# Resize image to match the number of samples we'll take
image = experimental_photo_utils.resize_image(
    image,
    int(circles_width * SAMPLE_LENGTH),
    int(circles_height * SAMPLE_LENGTH)
)
# Convert image to float32 before processing to prevent overflow
image = image.astype('float32')
image = experimental_photo_utils.grayscale_image(image, method="average")
image = experimental_photo_utils.buck_image_even_histogram_distribution(
    image, layer_count=len(RADIUS_MAPPING), preview=False
)

def are_all_pixels_in_bounds(row_index, col_index):
    for i in range(int(row_index), int(row_index + SAMPLE_LENGTH)):
        for j in range(int(col_index), int(col_index + SAMPLE_LENGTH)):
            if i < 0 or i >= image.shape[0] or j < 0 or j >= image.shape[1]:
                return False
    return True

def average_area(row_index, col_index):
    if not are_all_pixels_in_bounds(row_index, col_index):
        return -1

    total_area = 0
    count = 0
    for i in range(int(row_index), int(row_index + SAMPLE_LENGTH)):
        for j in range(int(col_index), int(col_index + SAMPLE_LENGTH)):
            total_area += image[i, j]
            count += 1
    return int(total_area / count)

for row_index in range(0, image.shape[0], SAMPLE_LENGTH):
    # Don't print last row
    if row_index > image.shape[0] - SAMPLE_LENGTH:
        break

    for col_index in range(0, image.shape[1], SAMPLE_LENGTH):
        # Don't print last column
        if col_index > image.shape[1] - SAMPLE_LENGTH:
            break

        radius = RADIUS_MAPPING[average_area(row_index, col_index)]
        if radius == -1:
            continue

        # Start with the outer radius and draw concentric circles inward
        current_radius = radius
        while current_radius > 0:
            plotter.layers['red_4'].add_circle(
                x_center=X_MIN + (col_index / SAMPLE_LENGTH) * OUTPUT_DIAMETER,
                y_center=Y_MIN + (row_index / SAMPLE_LENGTH) * OUTPUT_DIAMETER,
                radius=current_radius)
            current_radius -= layer['line_width']

plotter.preview()
plotter.save()