2025-01-18 Diagonal Lines
Description
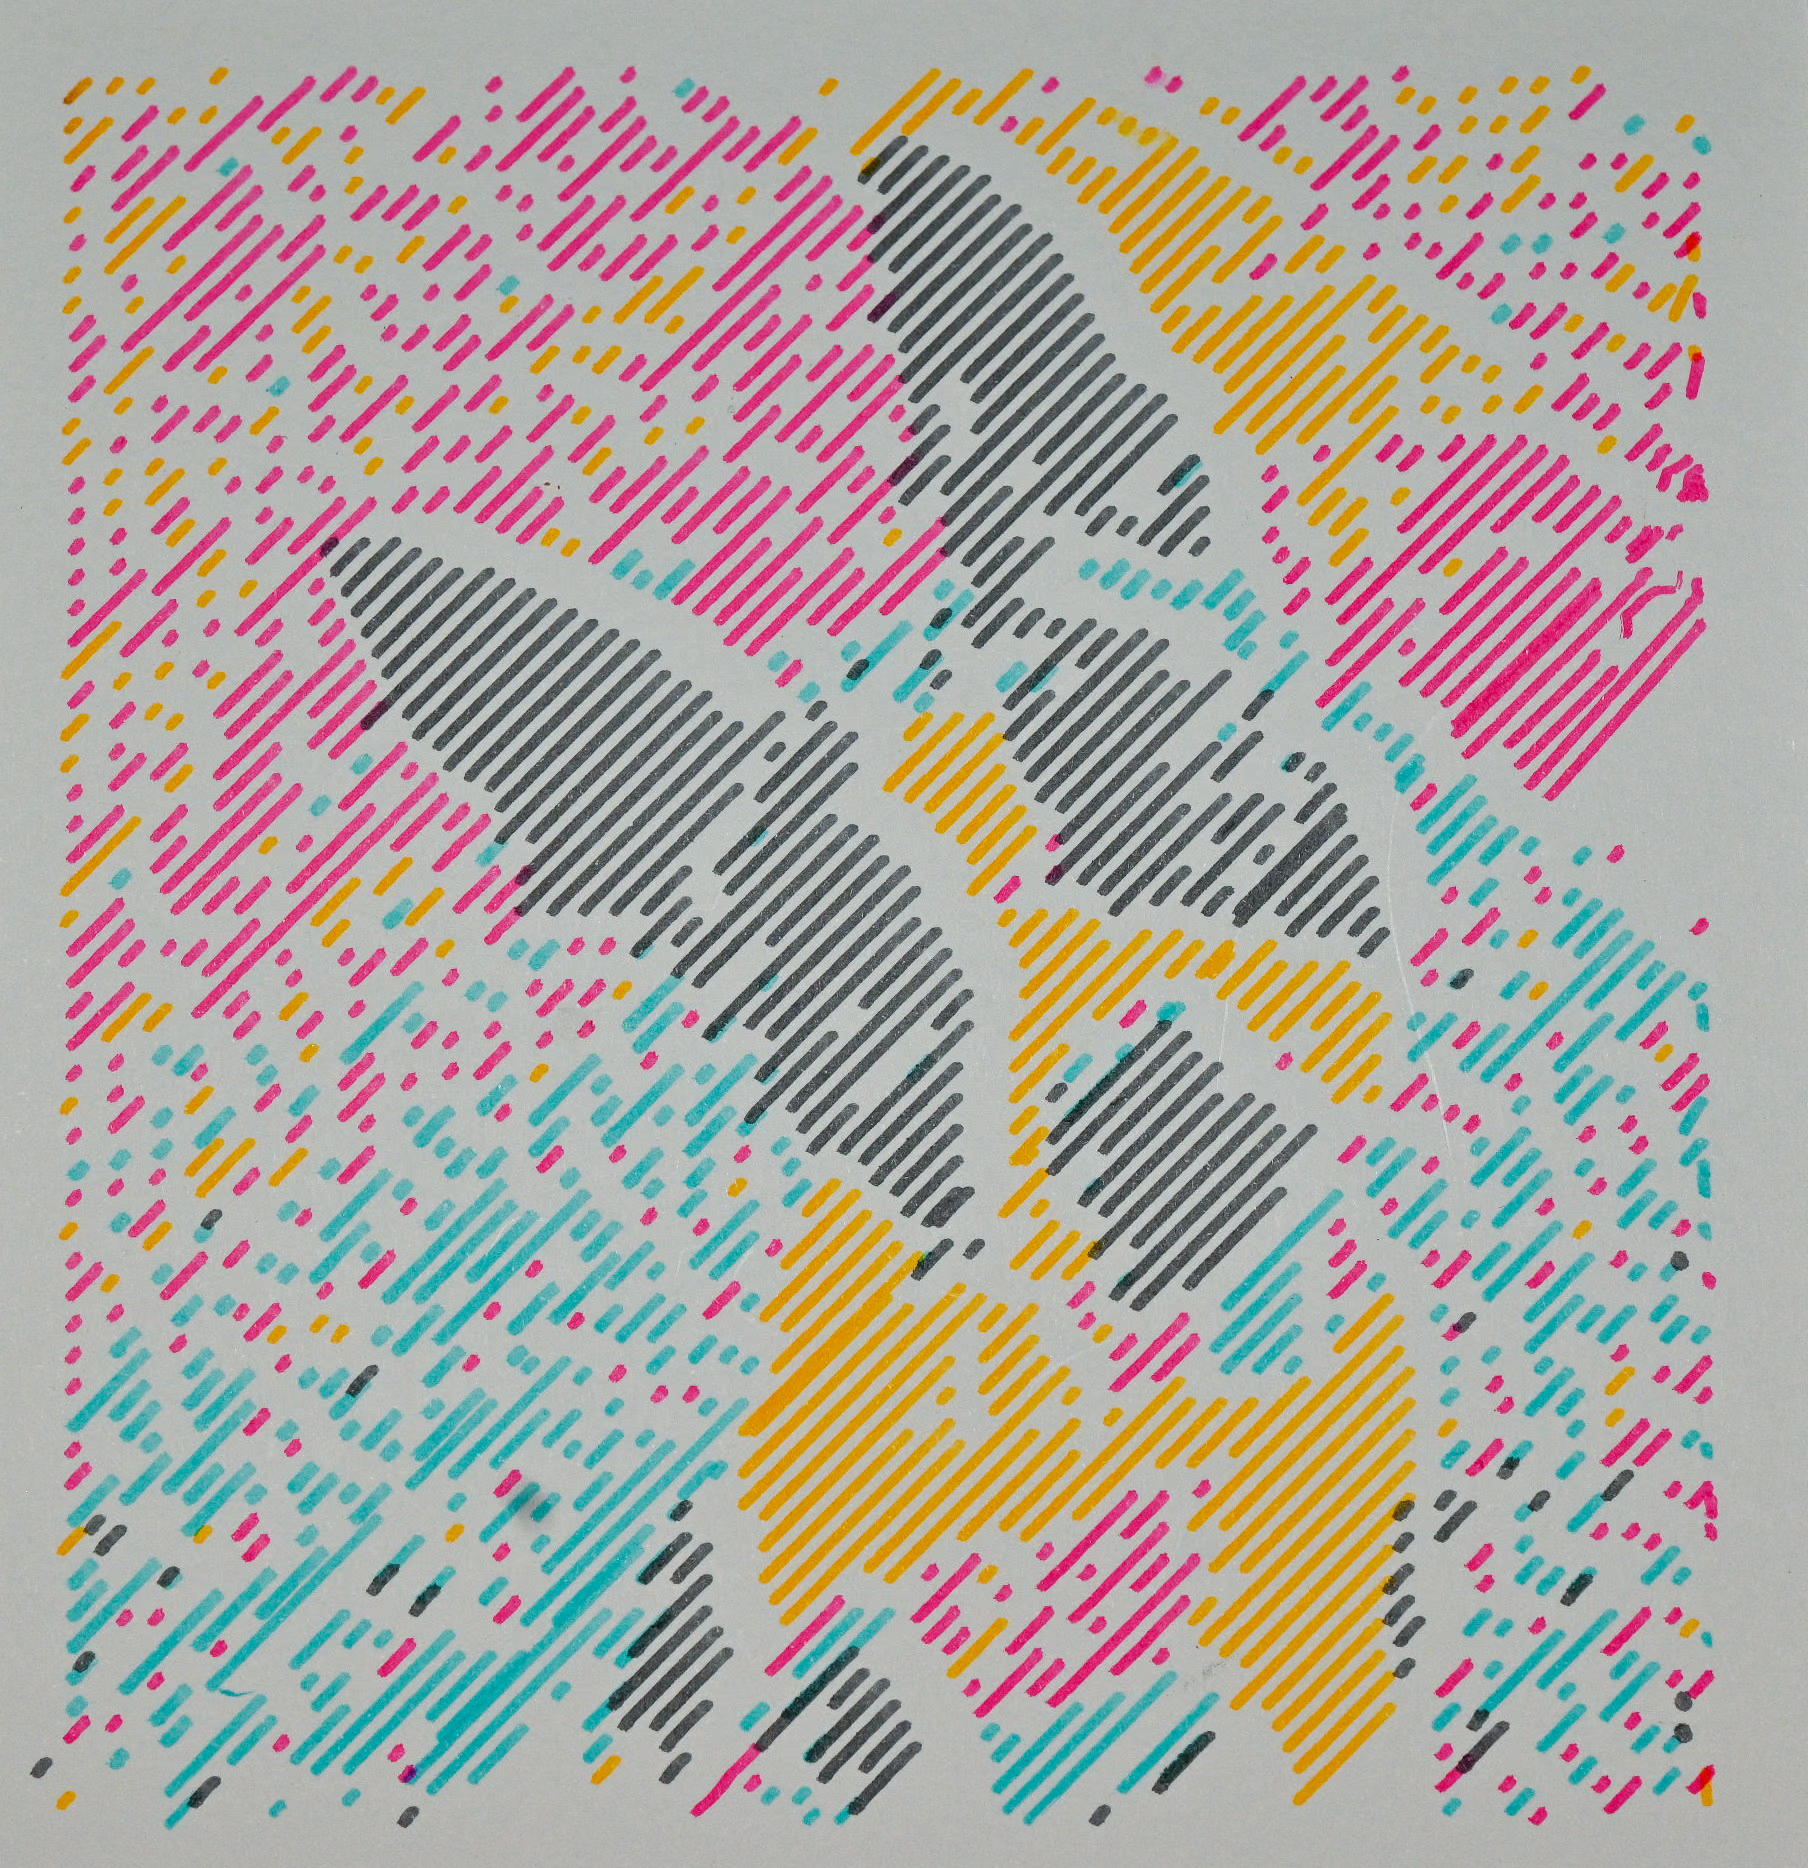
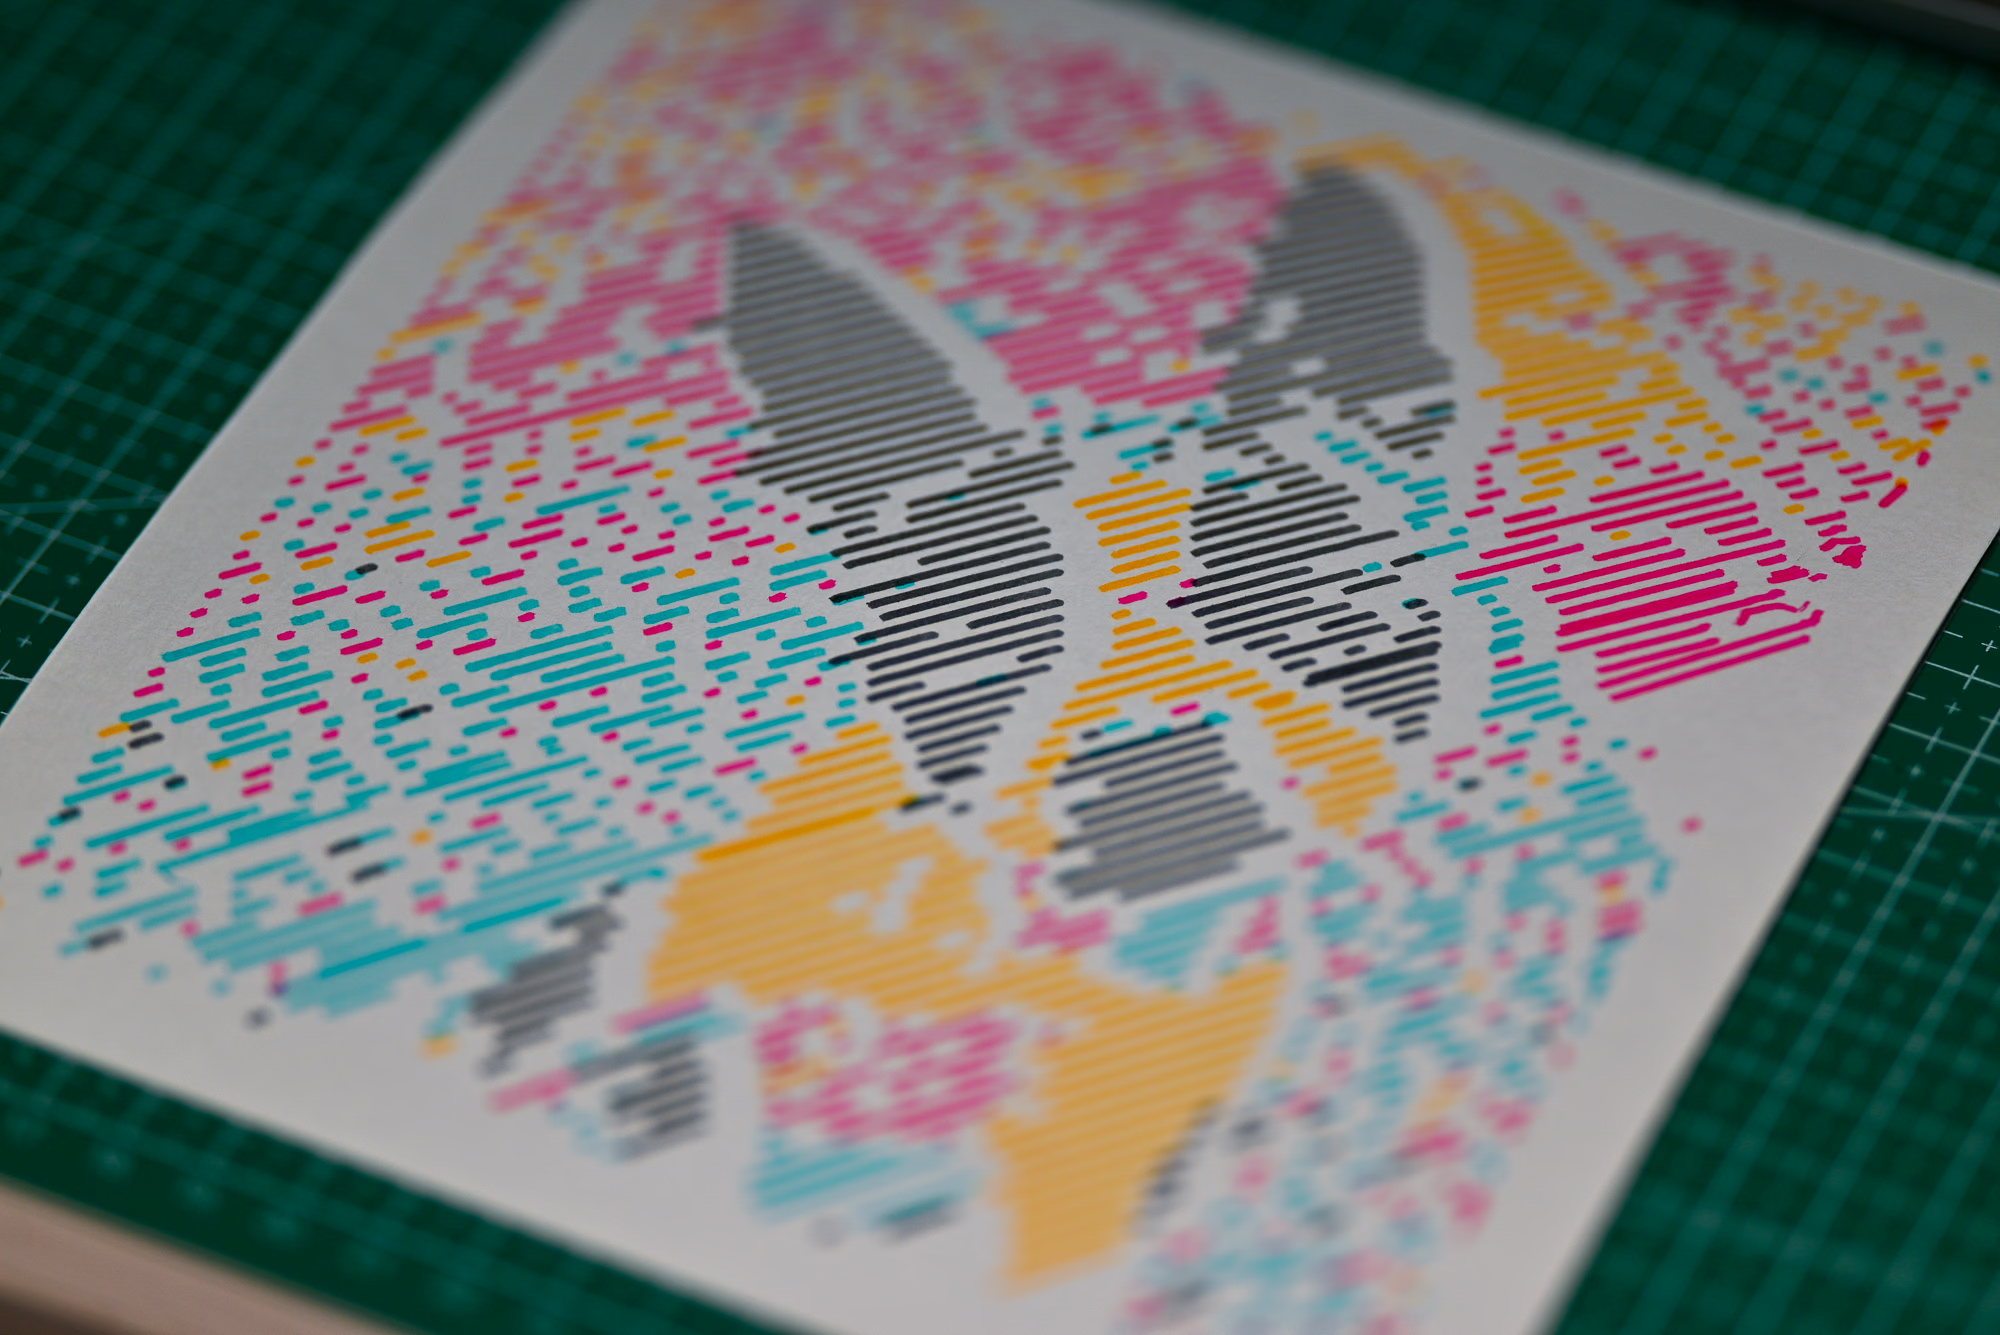
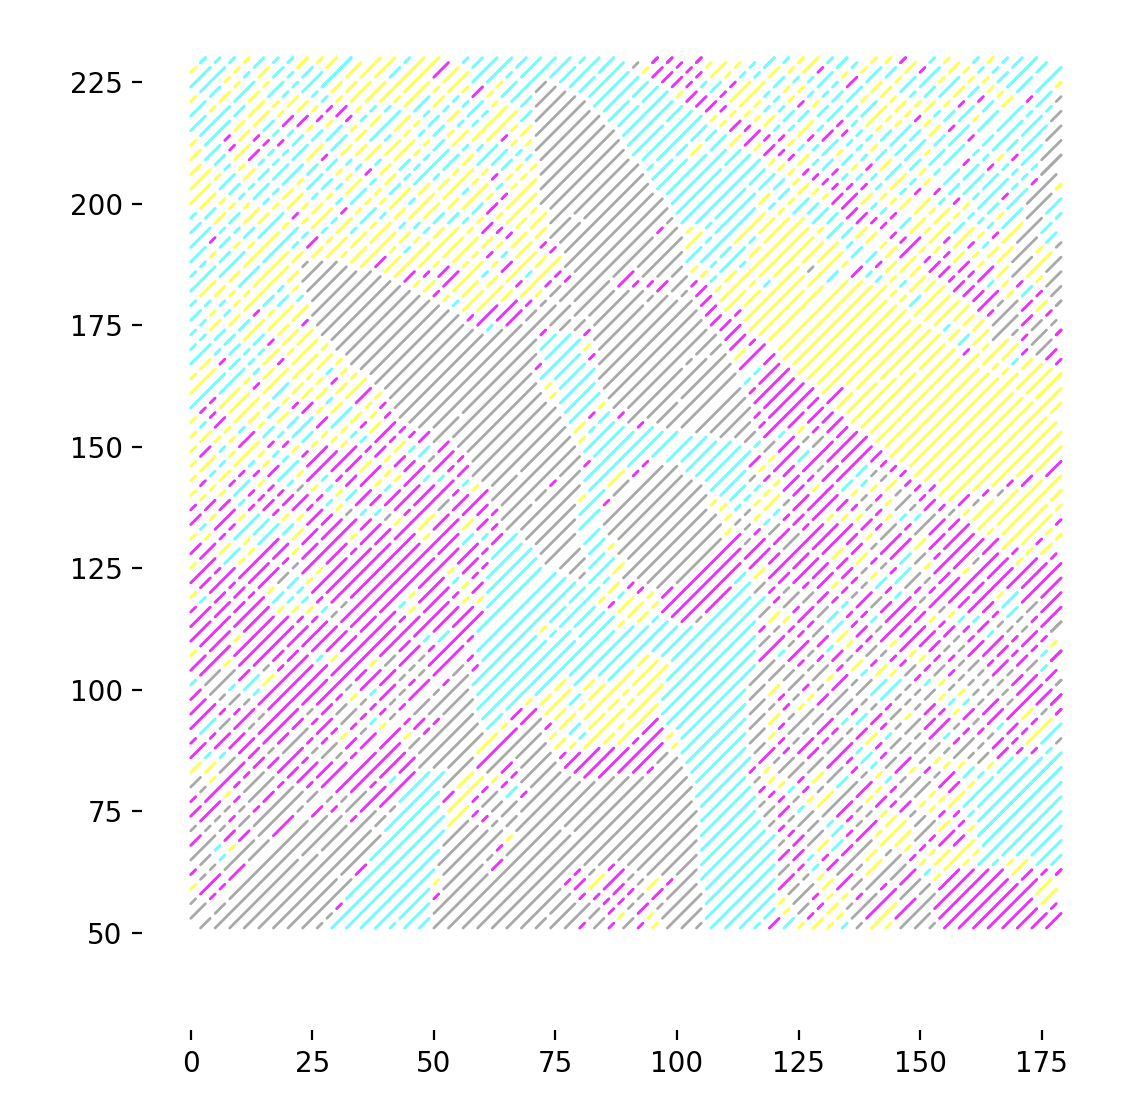
Convert image to just a few distinct colors and then diagonally cluster points into lines.
Images
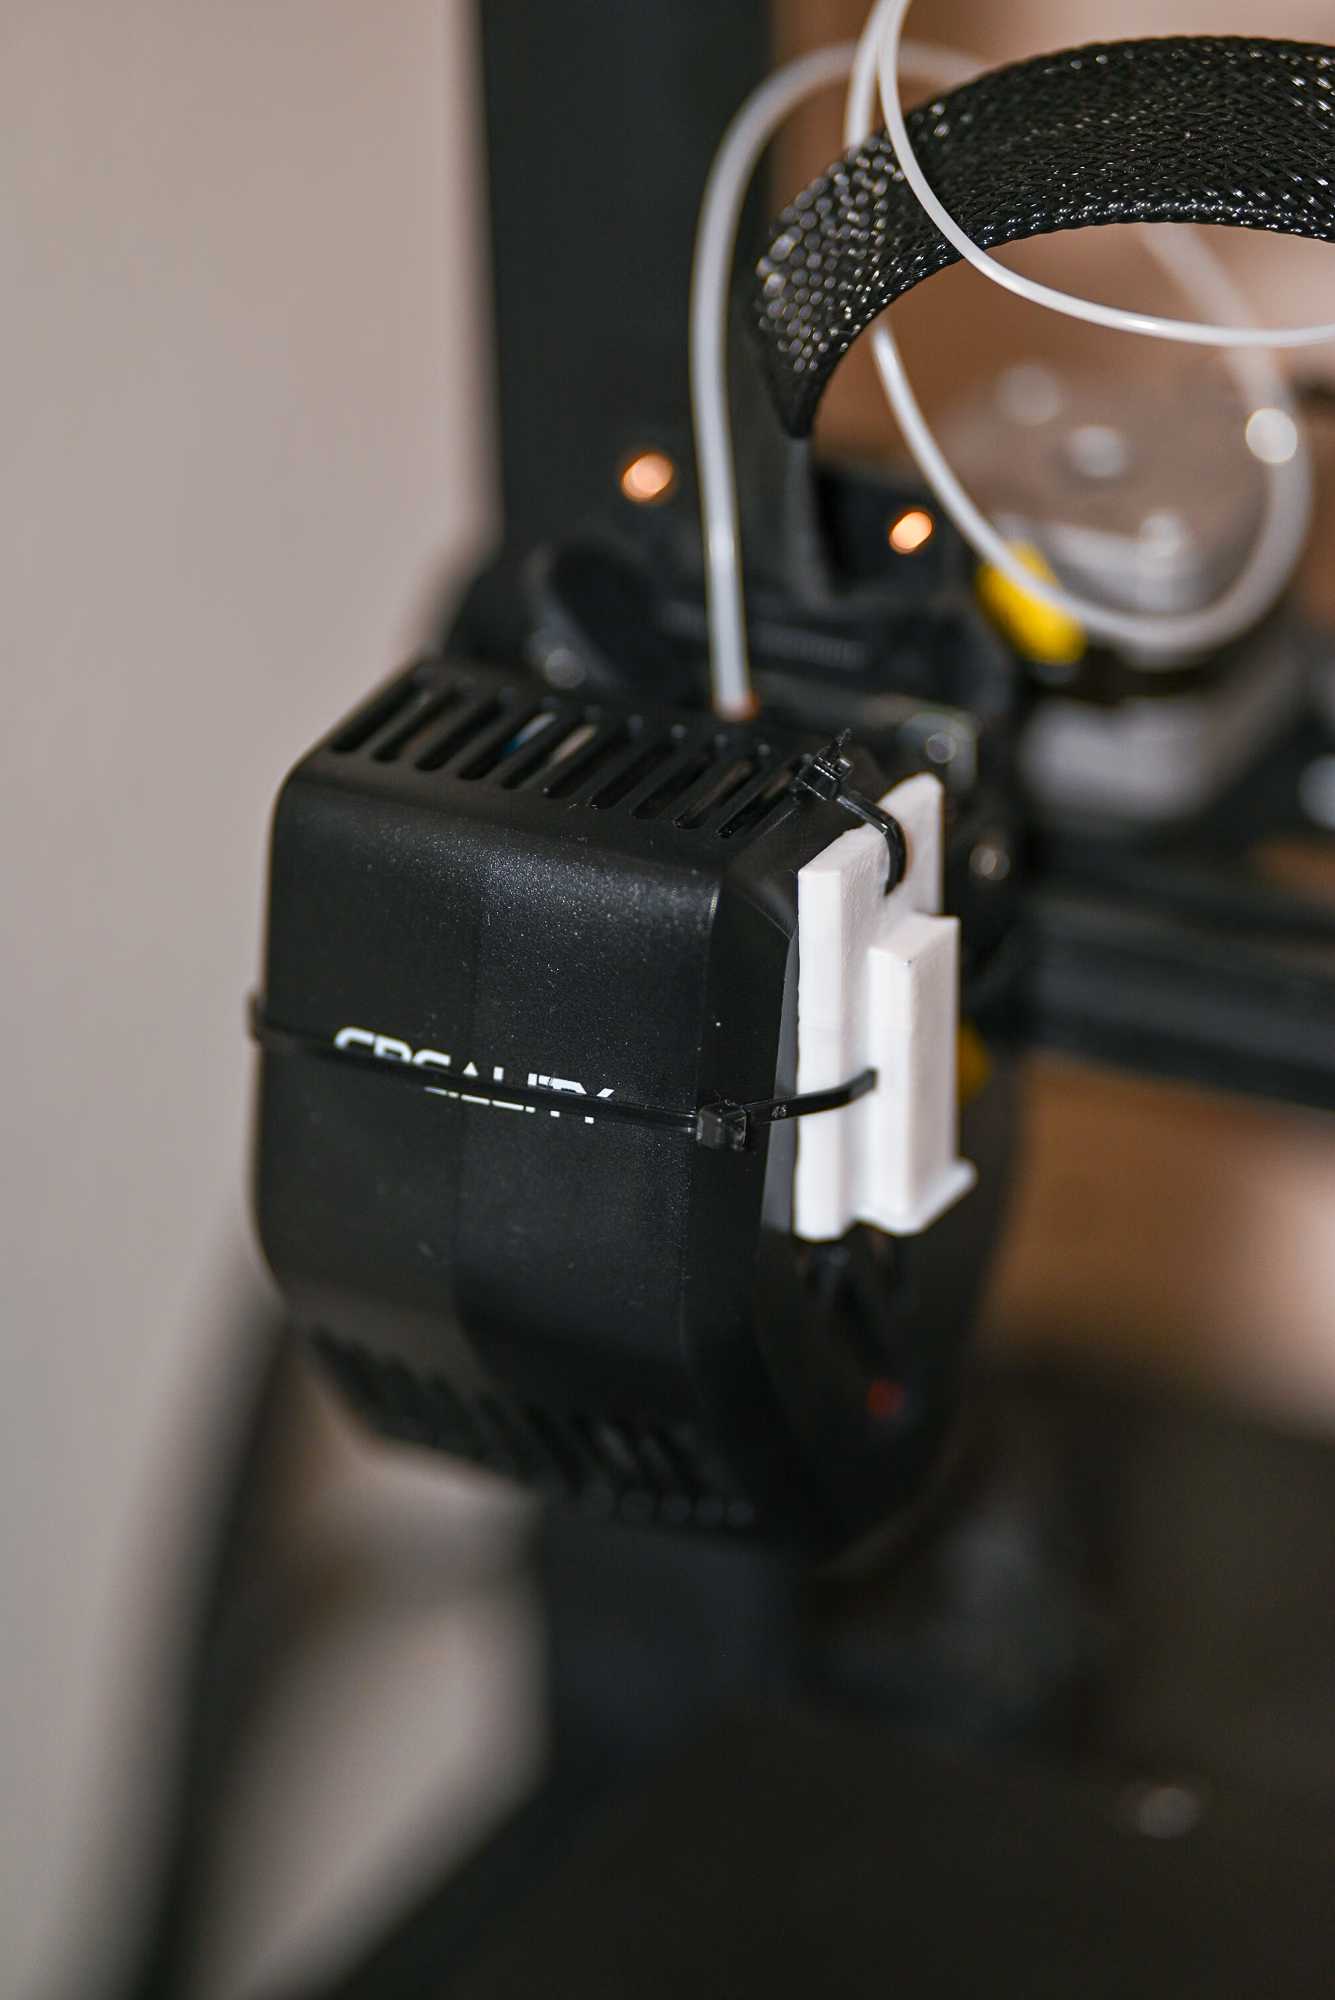
Inputs

Plotter Preview
Code
warning
This code may or may not run and is intended more as a reference. Additionally, it was most likely not written with the latest version of the library. To ensure compatibility, check the date of this post against the version history and install the corresponding version.
# Take a photo, process it into N buckets where each bucket has roughly the
# same number of pixels.
from random import shuffle
from gcode2dplotterart import Plotter3D
from gcode2dplotterart.experimental_photo_utils import (
    load_image,
    resize_image,
    grayscale_image,
    bucket_image_even_pixel_count,
)

image_path = "./test.jpeg"

GAP_BETWEEN_DIAGONALS = 3
GAP_BETWEEN_COLINEAR_LINES = 1

X_MIN = 0
X_MAX = 180
Y_MIN = 40
Y_MAX = 230
Z_PLOTTING_HEIGHT = 0
Z_NAVIGATION_HEIGHT = 4
PLOTTER_WIDTH = X_MAX - X_MIN
PLOTTER_HEIGHT = Y_MAX - Y_MIN
OFFSET_X = 0
OFFSET_Y = 0


LAYERS = [
    # 33
    {
        "title": "darkgrey",
        "color": "darkgrey",
        "line_width": 1.0,
    },
    # 40
    {
        "title": "cyan",
        "color": "cyan",
        "line_width": 1.0,
    },
    # 18
    # 15
    {
        "title": "magenta",
        "color": "magenta",
        "line_width": 1.0,
    },
    {
        "title": "yellow",
        "color": "yellow",
        "line_width": 1.0,
    },
]

shuffle(LAYERS)


image = load_image(image_path, preview=True)
image = resize_image(
    image, max_width=PLOTTER_WIDTH, max_height=PLOTTER_HEIGHT, preview=True
)
print("max dimensions", PLOTTER_WIDTH, PLOTTER_HEIGHT)
print("resized to", image.shape)
image = grayscale_image(image, method="luminosity", preview=True)
image = bucket_image_even_pixel_count(
    image, layer_count=len(LAYERS), preview=True
)


plotter = Plotter3D(
    title="Diagonal Lines",
    x_min=X_MIN,
    x_max=X_MAX,
    y_min=Y_MIN,
    y_max=Y_MAX,
    z_plotting_height=Z_PLOTTING_HEIGHT,
    z_navigation_height=Z_NAVIGATION_HEIGHT,
    feed_rate=10000,
    output_directory="./output",
    handle_out_of_bounds="Error",
    return_home_before_plotting=True,
)

for layer in LAYERS:
    plotter.add_layer(
        layer["title"], color=layer["color"], line_width=layer["line_width"]
    )

rows, cols = image.shape[:2]


def is_point_in_bounds(x, y):
    return x >= 0 and x < cols and y >= 0 and y < rows


def create_path(start_x, start_y):
    path = []
    x = start_x
    y = start_y
    while is_point_in_bounds(x, y):
        path.append((y, x))
        x += 1
        y -= 1
    return path


paths: list[tuple[int, int]] = []
start_col = 0
last_row = 0
for row in range(0, rows, GAP_BETWEEN_DIAGONALS):
    paths.append(create_path(start_col, row))
    last_row = row

# This should take care of the gap between the last row and the first column.
delta = abs(last_row - rows) - 1
print(f"Delta: {delta}")

# # Process origin at row n
start_row = rows - 1
for col in range(delta, cols, GAP_BETWEEN_DIAGONALS):
    paths.append(create_path(col, start_row))


for path in paths:
    line_start = path[0]
    color = LAYERS[image[line_start]]["title"]
    index = 0
    while index < len(path):
        point = path[index]
        current_color = LAYERS[image[point]]["title"]
        if current_color == color:
            index += 1

            if index >= len(path):
                row_start, col_start = line_start
                row_end, col_end = path[-1]
                plotter.layers[color].add_line(
                    col_start + X_MIN + OFFSET_X,
                    Y_MAX - row_start + OFFSET_Y,
                    col_end + X_MIN + OFFSET_X,
                    Y_MAX - row_end + OFFSET_Y,
                )
                break
            continue
        else:
            row_start, col_start = line_start
            row_end, col_end = point
            plotter.layers[color].add_line(
                col_start + X_MIN + OFFSET_X,
                Y_MAX - row_start + OFFSET_Y,
                col_end + X_MIN + OFFSET_X,
                Y_MAX - row_end + OFFSET_Y,
            )
            index += GAP_BETWEEN_COLINEAR_LINES
            if index >= len(path):
                row_start, col_start = line_start
                row_end, col_end = path[-1]
                plotter.layers[color].add_line(
                    col_start + X_MIN + OFFSET_X,
                    Y_MAX - row_start + OFFSET_Y,
                    col_end + X_MIN + OFFSET_X,
                    Y_MAX - row_end + OFFSET_Y,
                )
                break
            point = path[index]
            color = LAYERS[image[point]]["title"]
            line_start = point

plotter.preview()
plotter.save()