2023-07-15 Bunch of Lines
Description
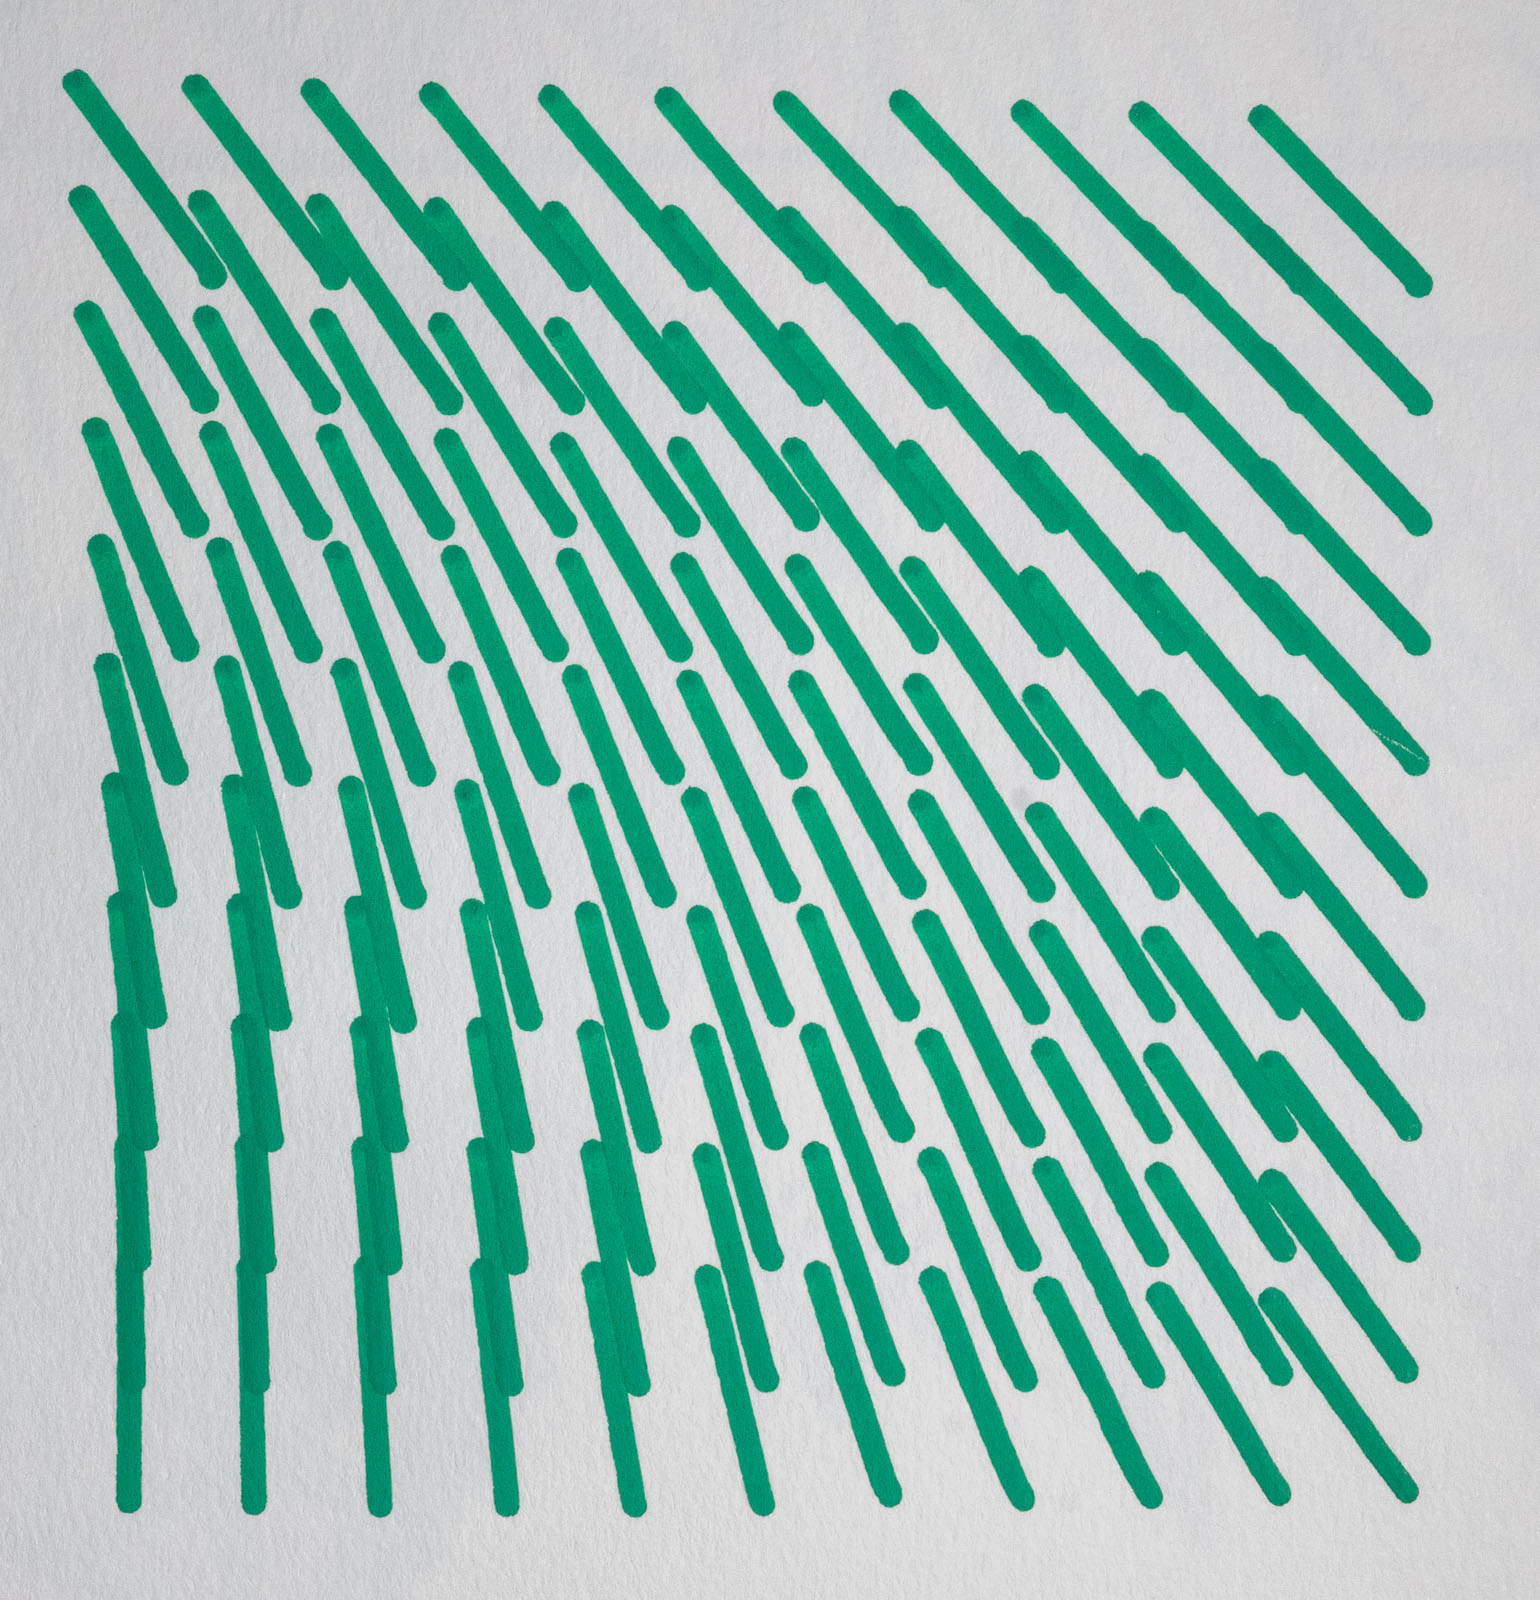
Take in a color. Plot a bunch of lines in a grid with a fixed length and a variable slope.
Images

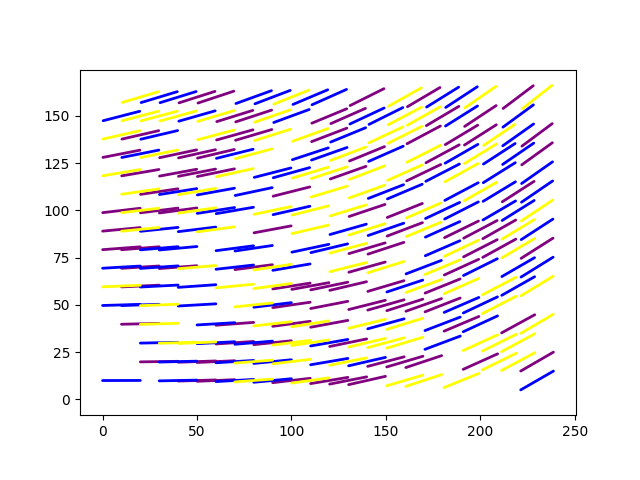
Plotter Preview
Code
warning
This code may or may not run and is intended more as a reference. Additionally, it was most likely not written with the latest version of the library. To ensure compatibility, check the date of this post against the version history and install the corresponding version.
from gcode2dplotterart import Plotter2D
from math import sin
from random import randint

plotter = Plotter2D(
    title="Bunch of Lines",
    x_min=0,
    x_max=240,
    y_min=0,
    y_max=170,
    feed_rate=10000,
    output_directory="./output",
    handle_out_of_bounds="Warning",
)

COLORS = ["purple", "blue", "yellow"]
HYPOTENUSE = 10

for color in COLORS:
    plotter.add_layer(title=color, color=color)

for x0 in range(plotter.x_min, plotter.x_max, 10):
    for y0 in range(plotter.y_min, plotter.y_max, 10):
        slope = sin((x0**2 + y0**2) / (plotter.x_max**2 + plotter.y_max**2))

        delta_x = HYPOTENUSE * (1 / (1 + slope**2)) ** 0.5
        delta_y = delta_x * slope

        x1 = x0 - delta_x
        y1 = y0 - delta_y

        x2 = x0 + delta_x
        y2 = y0 + delta_y

        rand = randint(0, len(COLORS))
        if rand == len(COLORS):
            # Every so often don't plot a line. For Art.
            continue

        plotter.layers[COLORS[rand]].add_line(x1, y1, x2, y2)


plotter.preview()
plotter.save()