2025-02-10 Juana and Nira
Description
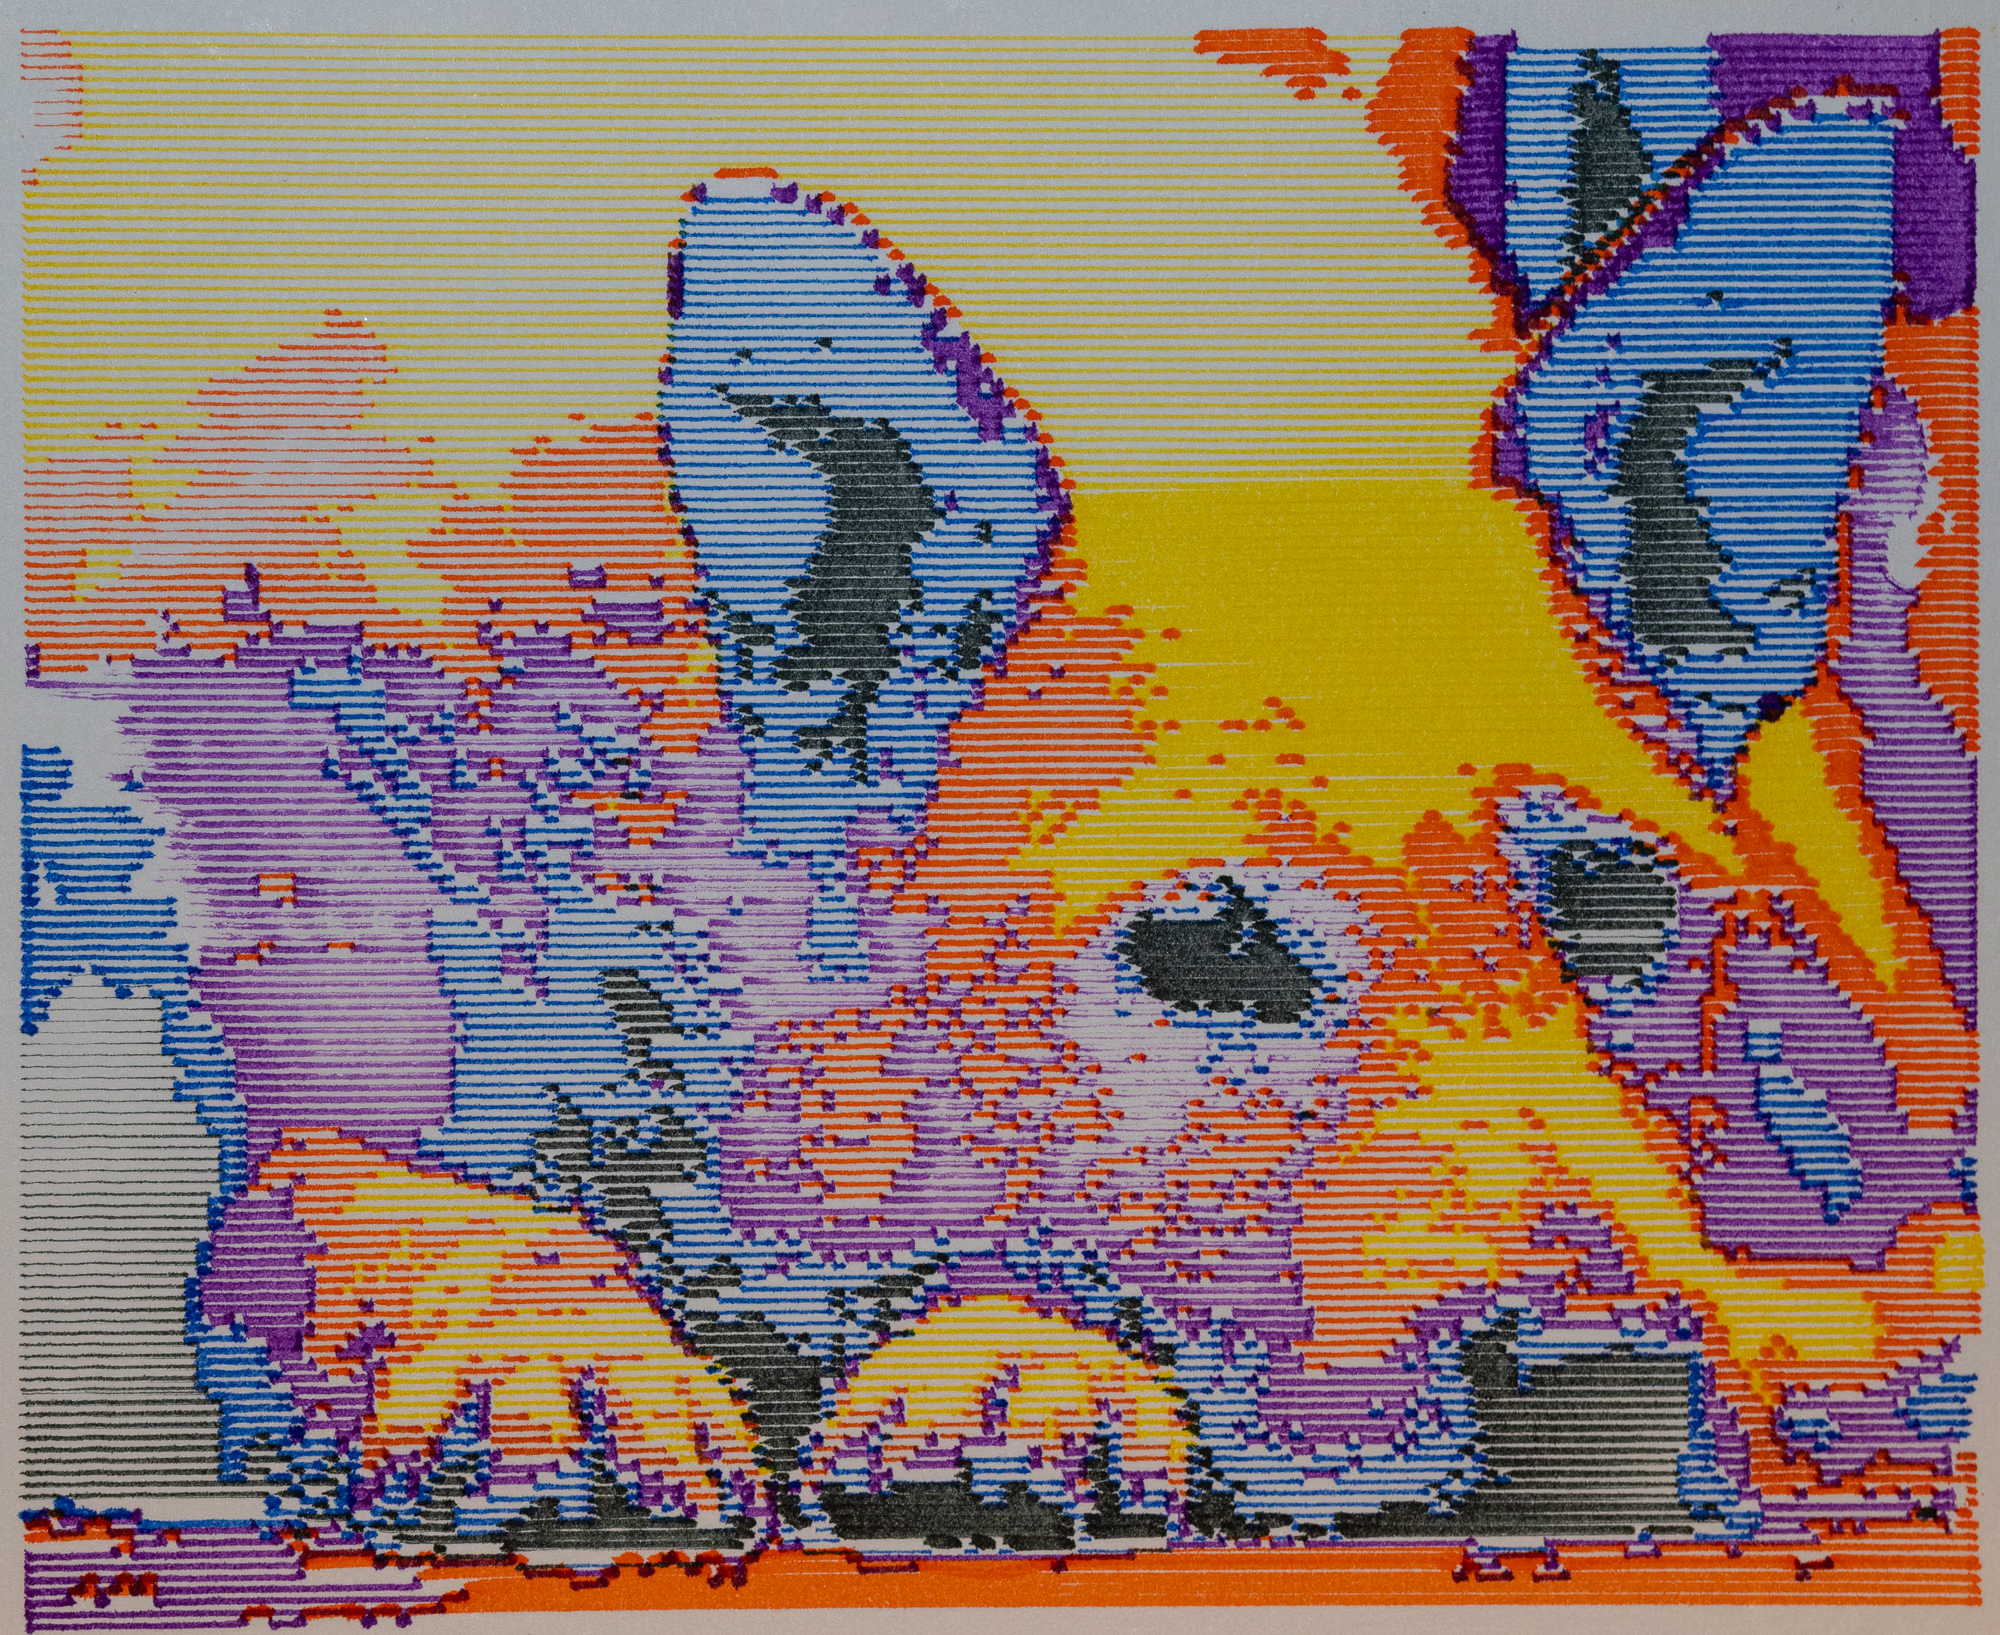
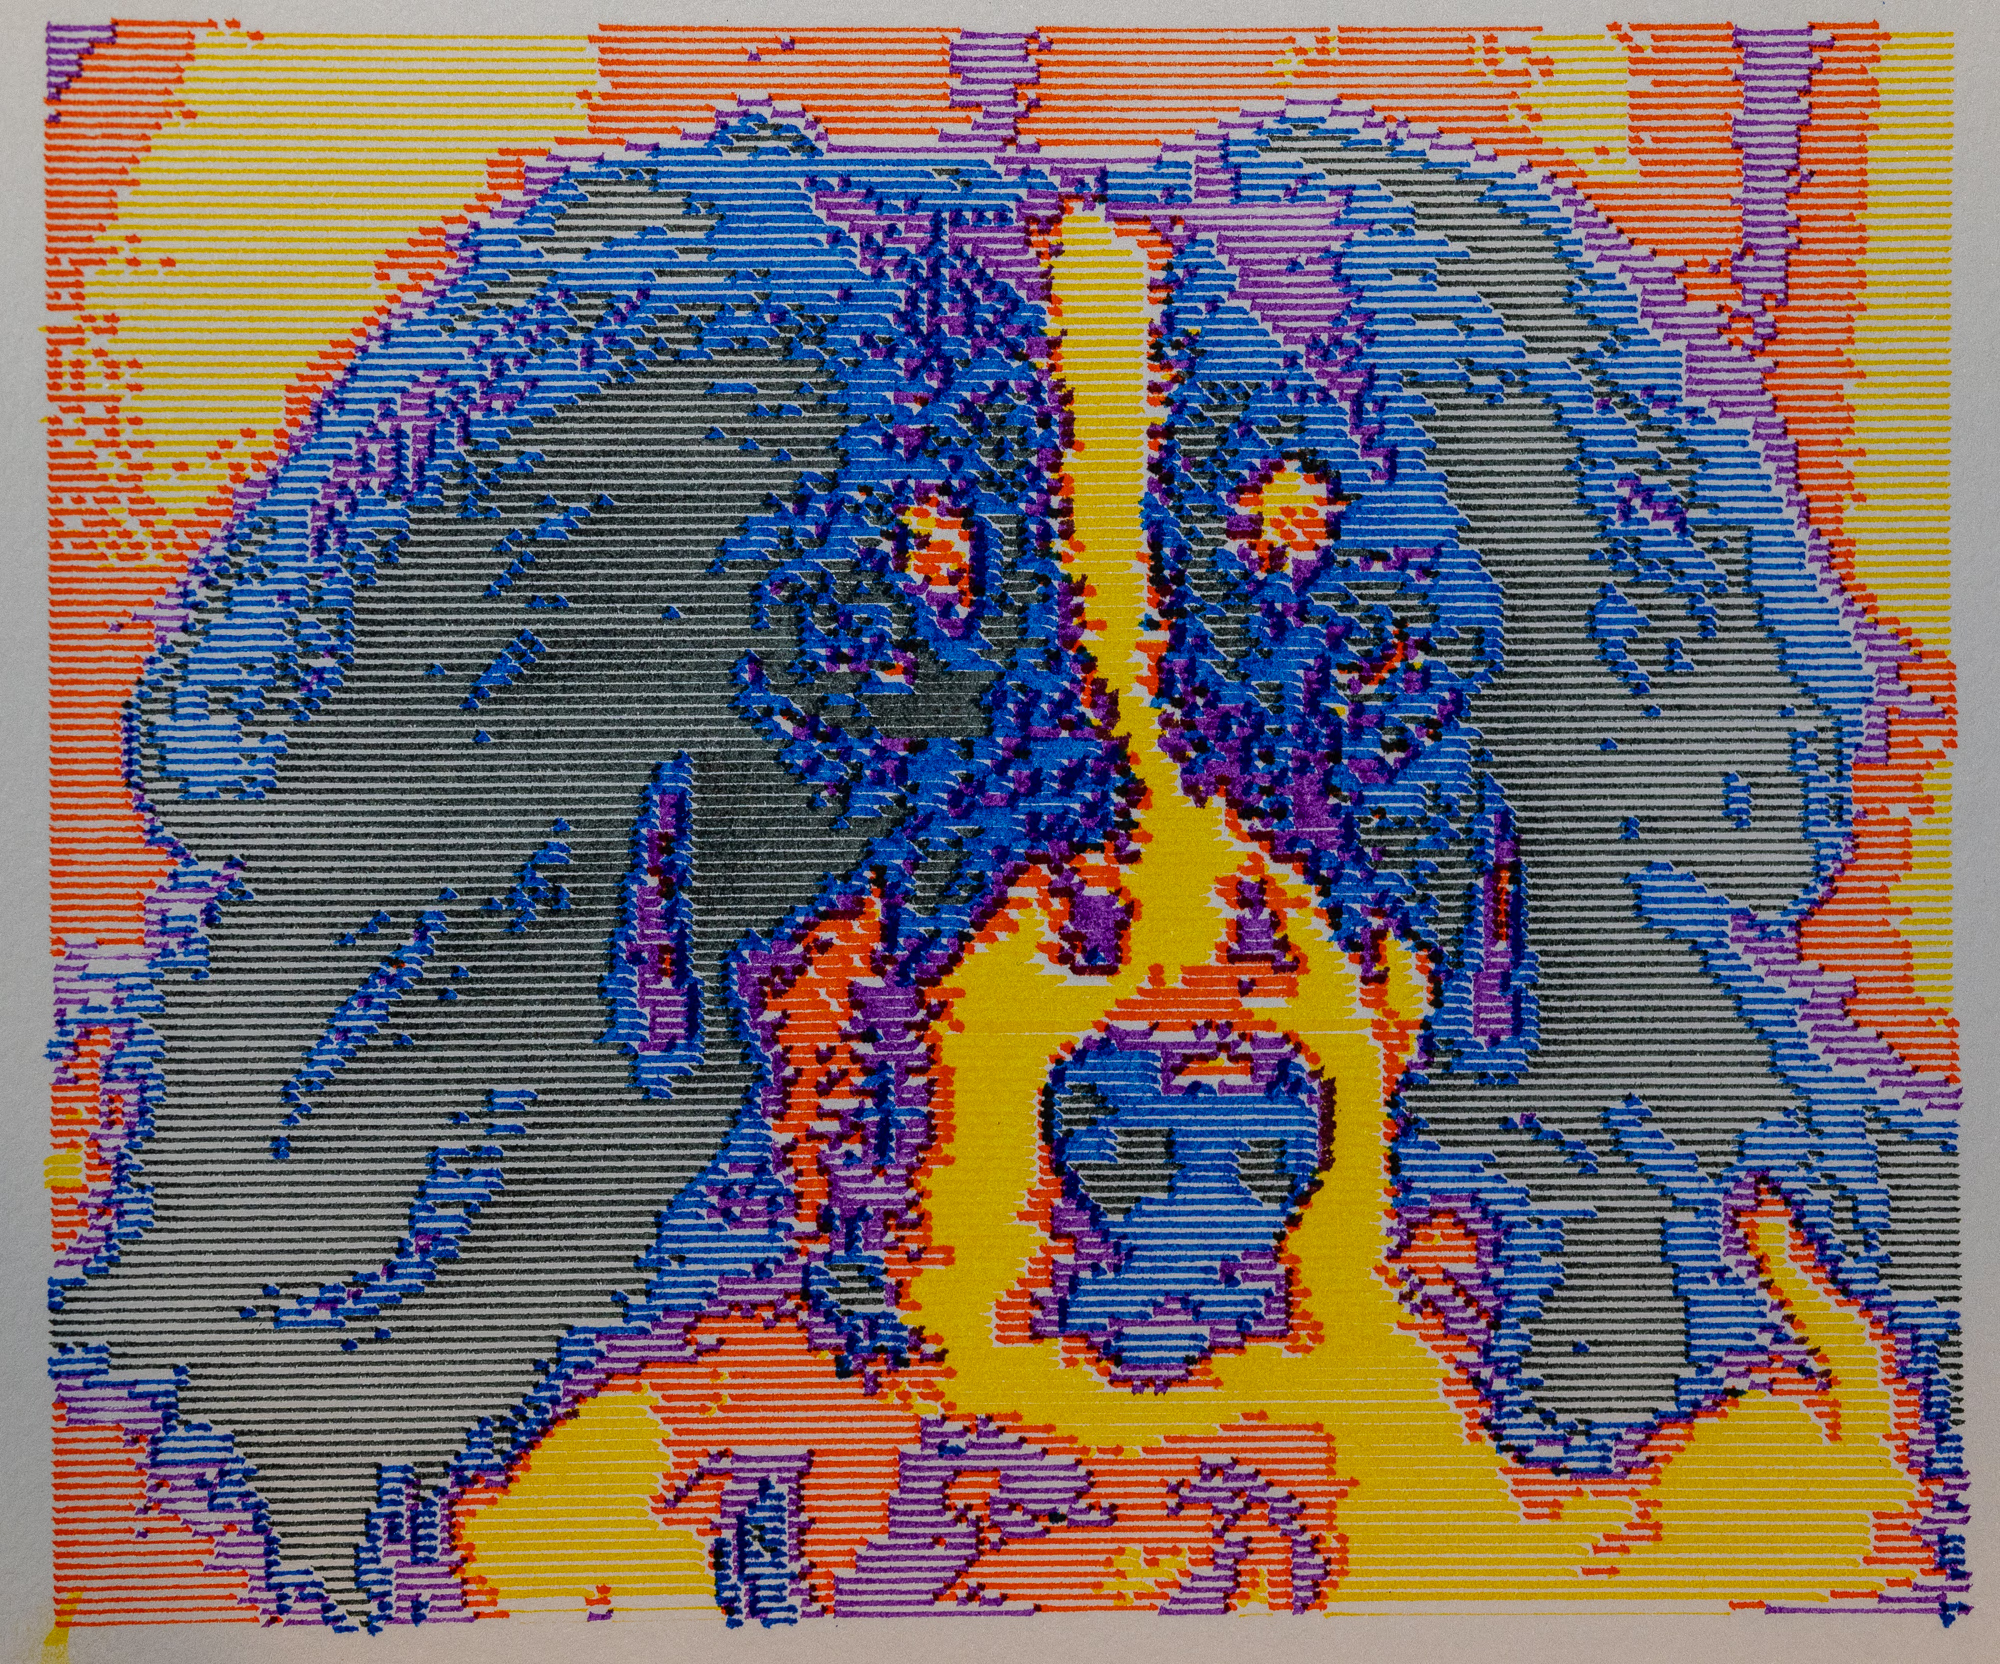
Map all the pixels in an image to a few distinct colors. Turn clusters of the same color into horizontal lines.
Images
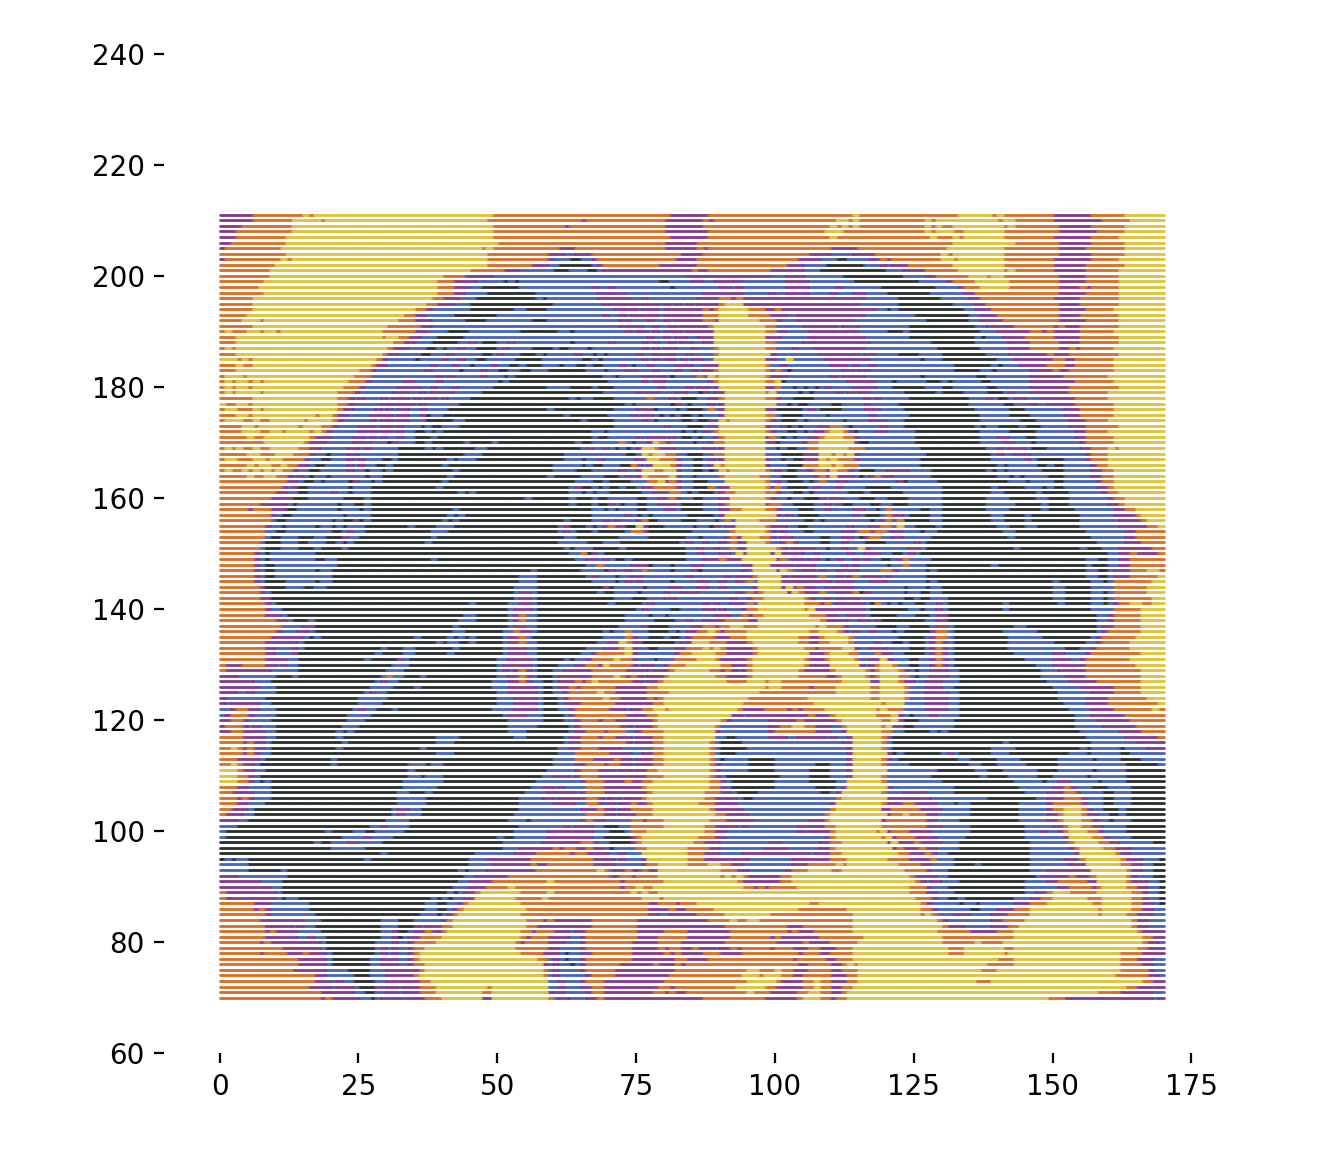
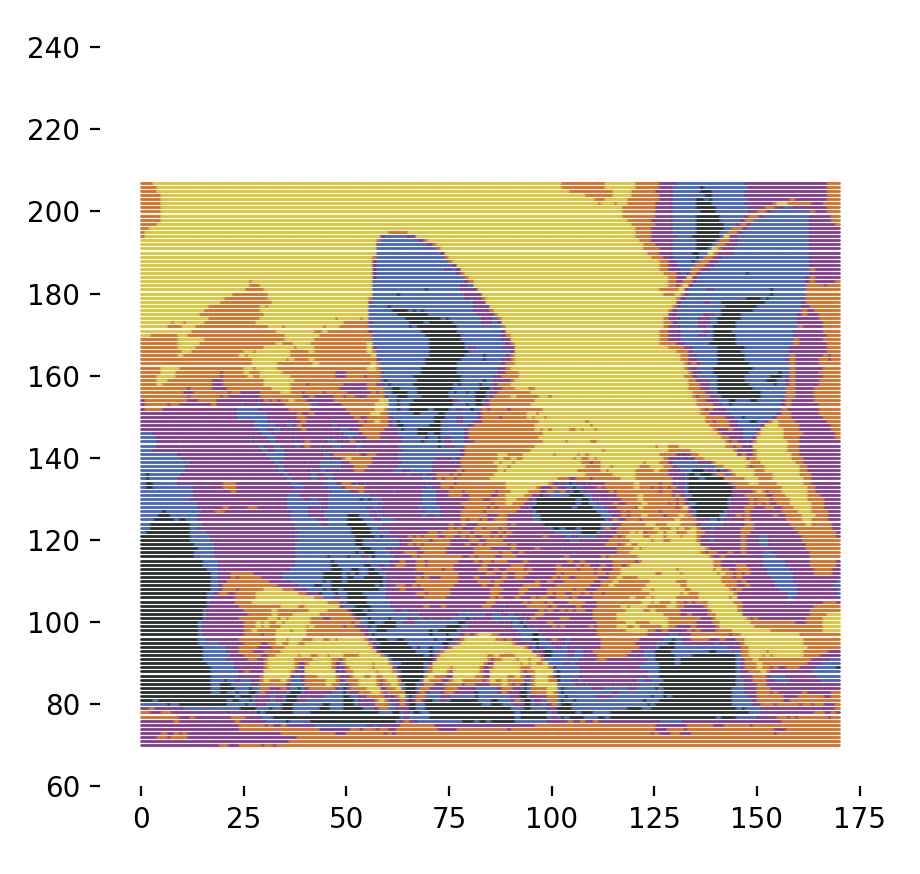
Plotter Preview
Code
warning
This code may or may not run and is intended more as a reference. Additionally, it was most likely not written with the latest version of the library. To ensure compatibility, check the date of this post against the version history and install the corresponding version.
from gcode2dplotterart import Plotter3D
from gcode2dplotterart import experimental_photo_utils

import math

X_MIN = 0
X_MAX = 170
Y_MIN = 70
Y_MAX = 230
Z_PLOTTING_HEIGHT = 0
Z_NAVIGATION_HEIGHT = 4

MAX_WIDTH = X_MAX - X_MIN
MAX_HEIGHT = Y_MAX - Y_MIN

plotter = Plotter3D(
    title="Dogs",
    x_min=X_MIN,
    x_max=X_MAX,
    y_min=Y_MIN,
    y_max=Y_MAX,
    z_plotting_height=Z_PLOTTING_HEIGHT,
    z_navigation_height=Z_NAVIGATION_HEIGHT,
    feed_rate=10_000,
    output_directory="./output",
    handle_out_of_bounds="Warning",
)

LAYERS = [
    {
        "title": "black_1",
        "color": "#252e2b",
        "line_width": 1,
    },
    {
        "title": "blue_40",
        "color": "#3b65c1",
        "line_width": 1,
    },
    {
        "title": "purple_33",
        "color": "#8e3392",
        "line_width": 1,
    },
    {
        "title": "orange_7",
        "color": "#e76500",
        "line_width": 1,
    },
    {
        "title": "yellow_11",
        "color": "#e0c200",
        "line_width": 1,
    },
]
for layer in LAYERS:
    plotter.add_layer(
        layer["title"], color=layer["color"], line_width=layer["line_width"]
    )

image_path = "./inputs/2.jpg" #Juana
# image_path = "./inputs/3.jpg" # Nira

image = experimental_photo_utils.load_image(image_path)
image = experimental_photo_utils.resize_image(image, MAX_WIDTH, MAX_HEIGHT)
# Convert image to float32 before grayscale conversion to prevent overflow, this is probably worth research.
image = image.astype("float32")
image = experimental_photo_utils.grayscale_image(image, method="average")
image = experimental_photo_utils.buck_image_even_histogram_distribution(
    image, layer_count=len(LAYERS), preview=True
)

rows, cols = image.shape[:2]

for row_index, row in enumerate(image):
    current_layer = LAYERS[row[0]]["title"]

    path_start = (0, row_index)

    for point_index, point in enumerate(row):
        point_layer = LAYERS[point]["title"]
        if point_layer == current_layer:
            continue
        else:
            path_end = (point_index, row_index)
            plotter.layers[current_layer].add_line(
                x_start=X_MIN + path_start[0],
                y_start=Y_MIN + path_start[1],
                x_end=X_MIN + path_end[0],
                y_end=Y_MIN + path_end[1],
            )
            path_start = (point_index, row_index)
            current_layer = point_layer

    plotter.layers[current_layer].add_line(
        x_start=X_MIN + path_start[0],
        y_start=Y_MIN + path_start[1],
        x_end=X_MIN + cols,
        y_end=Y_MIN + path_start[1],
    )


plotter.preview()
plotter.save()