2023-11-15 Image Lines
Description
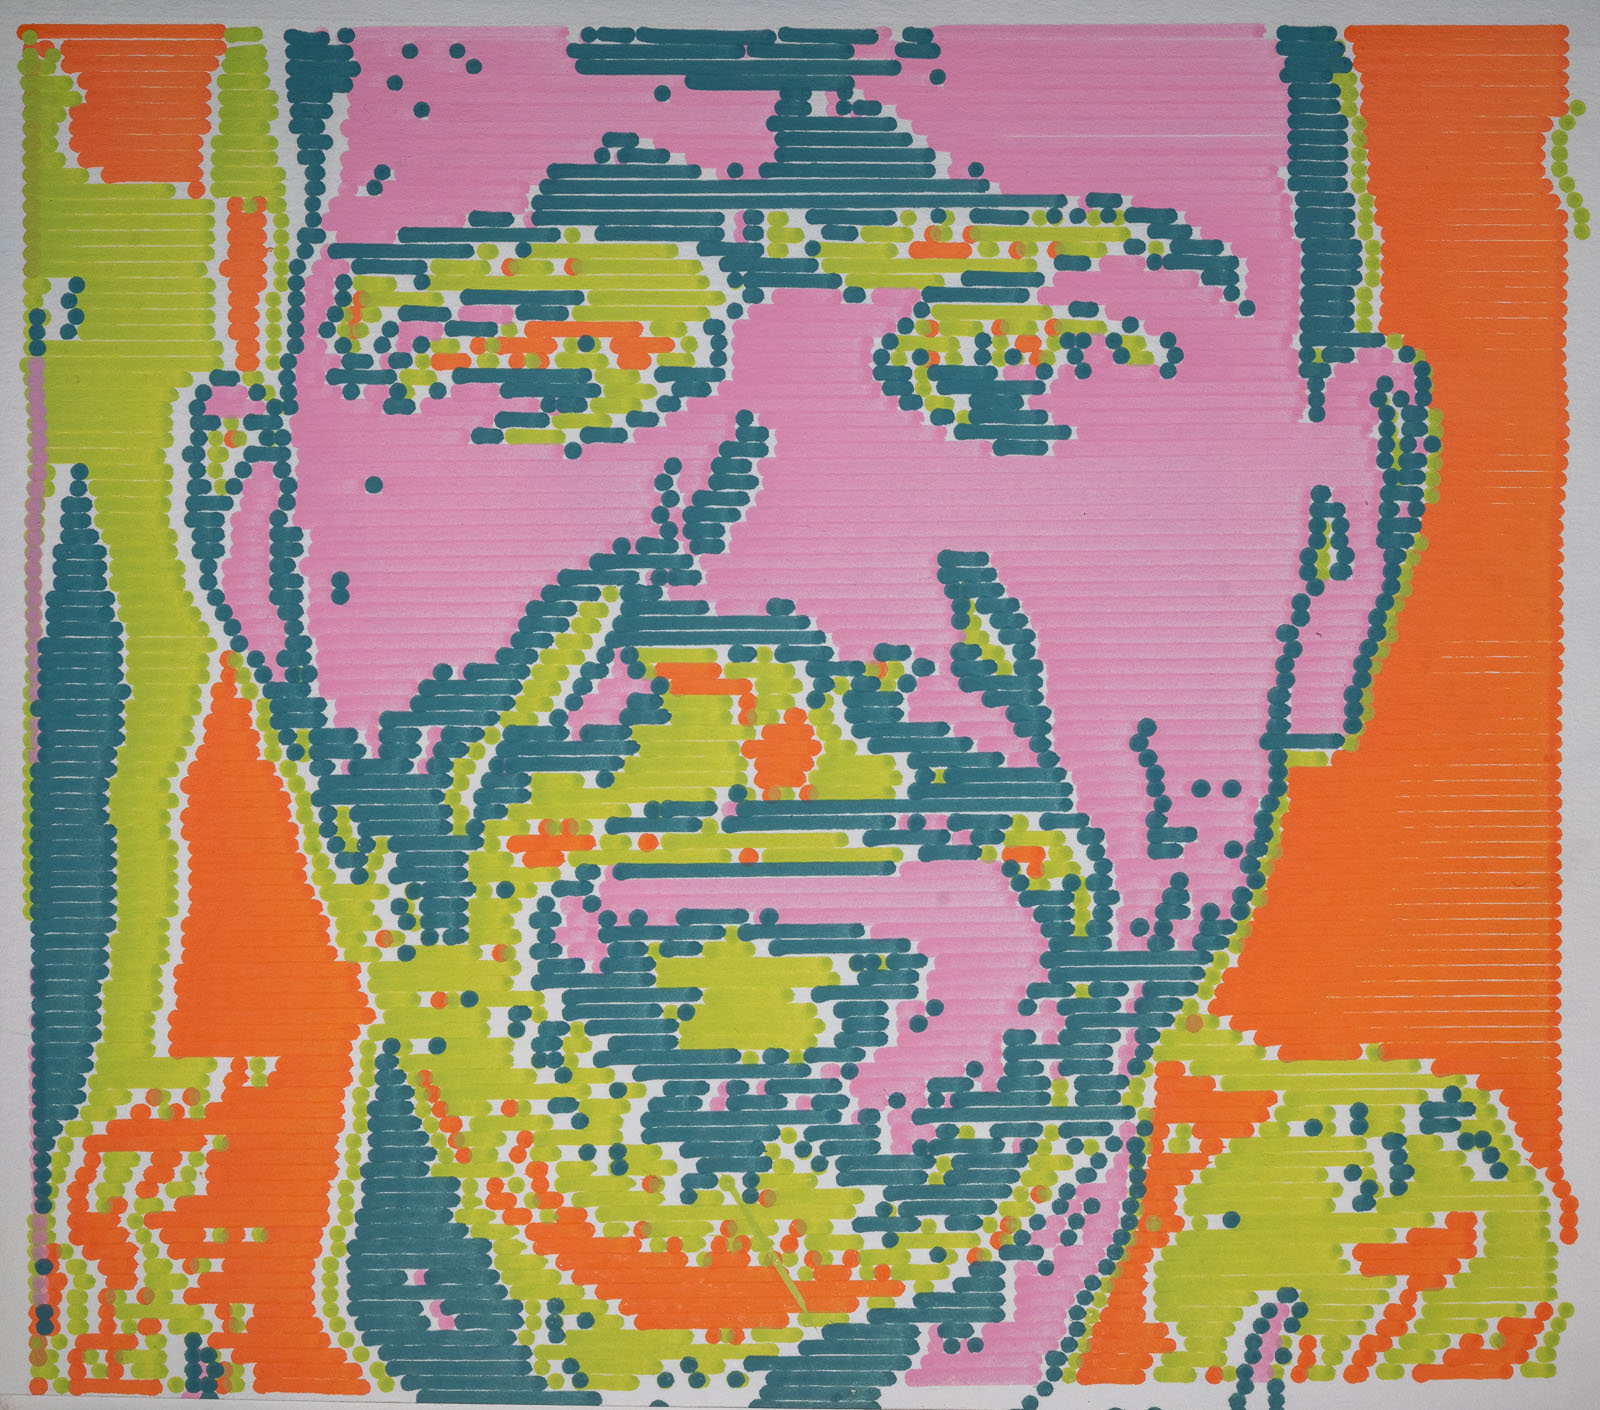
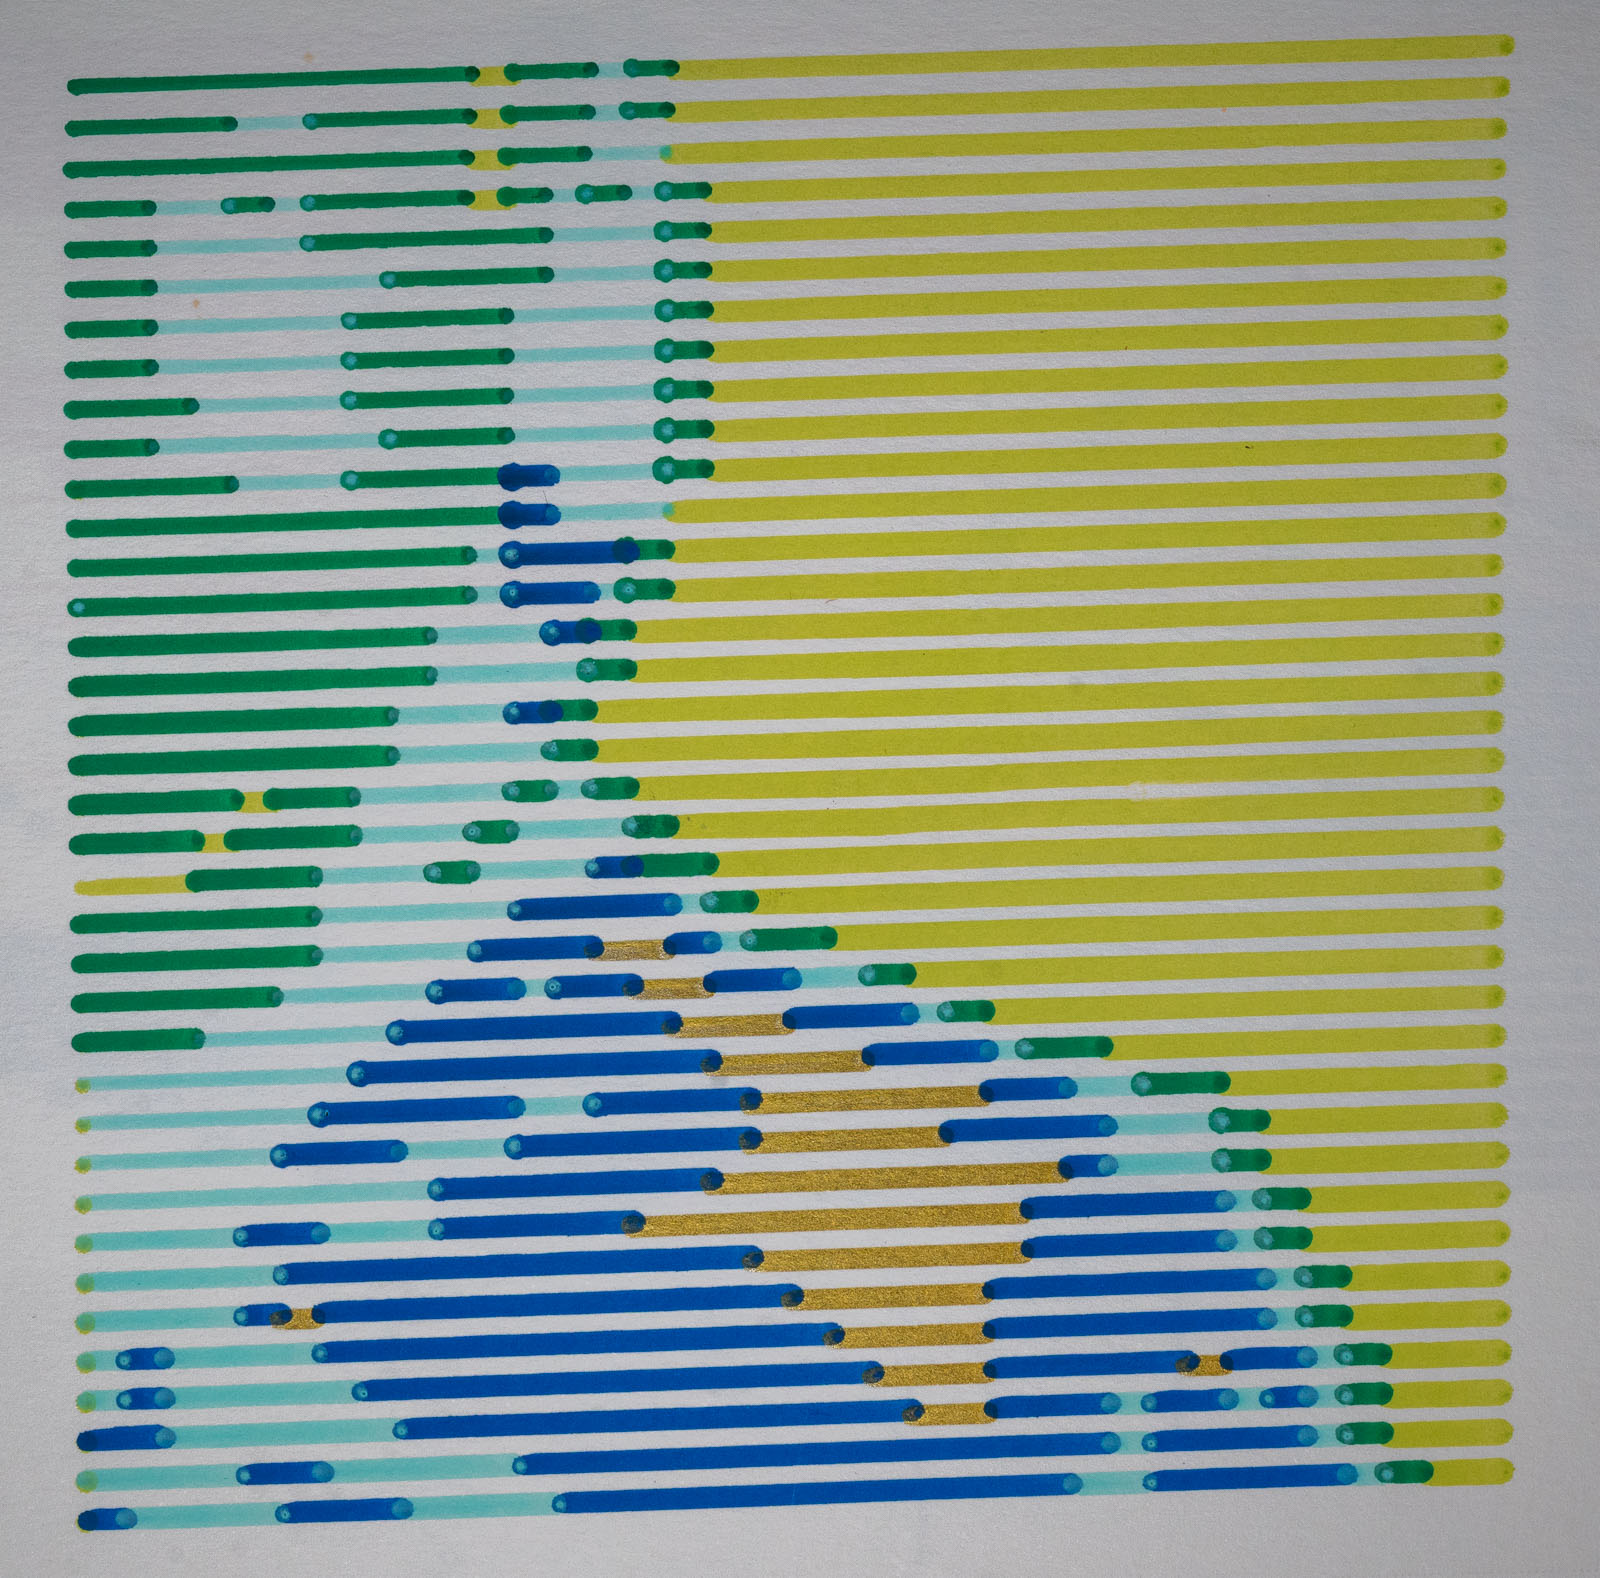
Convert an image into a series of parallel lines where each line is one of N colors.
Images
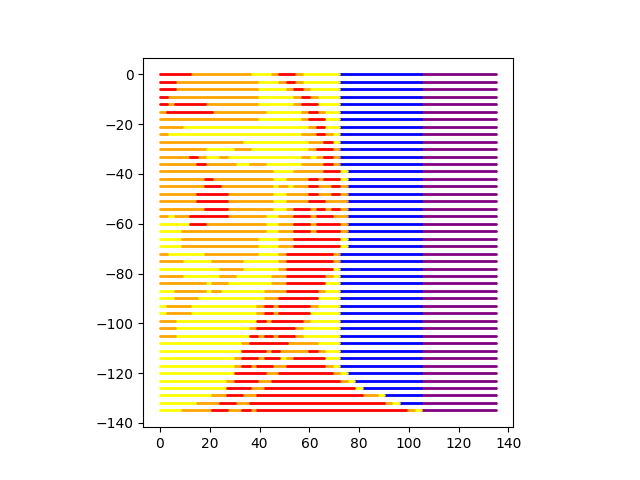
Plotter Preview
Code
warning
This code may or may not run and is intended more as a reference. Additionally, it was most likely not written with the latest version of the library. To ensure compatibility, check the date of this post against the version history and install the corresponding version.
from gcode2dplotterart import Plotter2D
import cv2
import numpy as np
from imutils import resize
from math import floor
from typing import List

"""
Preface - numpy and cv2 are still a bit alien to me. The code here could be done better.

1. Take in an image.
2. Grayscale all of the pixels so that each pixel is represented by a number from 0 to 255.
3. Bucket the pixels such that
  - 0 -> A   becomes 0
  - A -> B   becomes 1
  - B -> C   becomes 2
  - C -> 255 becomes 3
4. Start with the first row of pixels.
5. Add the first point to a new path and move to the next pixel.
6. If the current pixel is the same as the previous pixel, append the point to the path and repeat, otherwise,
    start a new path.
7. Continue until all points of all colors are plotted.

Note
- Make sure that the combination of X_SCALE, Y_SCALE, and the resized image aren't too big for the plotter area.

"""

# These numbers can be changed in combination with the image size. Adds a bit of spacing since I use thicker
# pens and they'd overlap.
X_PIXELS_PER_PLOTTER_UNIT = 1 / 3
Y_PIXELS_PER_PLOTTER_UNIT = 1 / 3


def evenly_distribute_pixels_per_color(
    img: cv2.typing.MatLike, n: int
) -> List[List[int]]:
    """
    Ensures that each color has the same number of pixels.

    Arg:
        `img` : cv2.typing.MatLike
            The image to process
        `n` : Number of colors to distribute pixels into

    Returns
    `   img` : List[List[int]]
           Image mapped to n colors
    """

    total_pixels = img.size
    pixel_bins = []
    histogram, bins = np.histogram(img.ravel(), 256, (0, 256))
    count = 0
    for pixel_value, pixel_count in enumerate(histogram):
        if count >= total_pixels / (n):
            count = 0
            pixel_bins.append(pixel_value)
        count += pixel_count

    return np.subtract(np.digitize(img, pixel_bins), 0)


def resize_image_for_plotter(filename: str) -> List[List[int]]:
    img = cv2.imread(filename)
    img = cv2.cvtColor(img, cv2.COLOR_BGR2GRAY)

    # The following math will ensure that the image is scaled to the plotter size and the remaining math
    # throughout the program will work.
    plotter_ratio = "landscape" if plotter.width > plotter.height else "portrait"
    # It appears shape is (columns, rows)
    img_ratio = "landscape" if img.shape[1] > img.shape[0] else "portrait"
    if (
        plotter_ratio == "landscape"
        and img_ratio == "landscape"
        or plotter_ratio == "portrait"
        and img_ratio == "landscape"
    ):
        img = resize(img, width=floor(plotter.width * X_PIXELS_PER_PLOTTER_UNIT))
    elif (
        plotter_ratio == "portrait"
        and img_ratio == "portrait"
        or plotter_ratio == "landscape"
        and img_ratio == "portrait"
    ):
        print("resizing height")
        img = resize(img, height=floor(plotter.height * Y_PIXELS_PER_PLOTTER_UNIT))

    print("resized to ", img.shape)
    return img


plotter = Plotter2D(
    title="Horizontal Line Art",
    x_min=0,
    x_max=200,
    y_min=-140,  # Note - My plotting goes from -150 to 0.
    y_max=0,
    feed_rate=10000,
    output_directory="./output",
    handle_out_of_bounds="Warning",  # It appears that some points end up outside of bounds so scale down.
)

COLOR_LAYERS = [
    "purple",
    "blue",
    "yellow",
    "orange",
    "red",
]
for layer in COLOR_LAYERS:
    plotter.add_layer(layer, color=layer)

input_filename = "landscape.jpg"

# Works with color PNGs exported from Lightroom and Photoshop. Could learn some more about reading images
resized_image = resize_image_for_plotter(input_filename)
color_reduced_image = evenly_distribute_pixels_per_color(
    resized_image, n=len(COLOR_LAYERS)
)


for y_index, row in enumerate(color_reduced_image):
    y_plotter_scale = (
        y_index / Y_PIXELS_PER_PLOTTER_UNIT * -1
    )  # My plotter goes y=-150 to y=0, therefore numbers are negative. Probably a better solution.
    line_start = [0, y_plotter_scale]
    line_end = None
    current_color_value = color_reduced_image[0][y_index]

    for x_index, color_value in enumerate(row):
        x_plotter_scale = x_index / X_PIXELS_PER_PLOTTER_UNIT
        if color_value == current_color_value:
            continue

        line_end = [x_plotter_scale, y_plotter_scale]
        plotter.layers[COLOR_LAYERS[current_color_value]].add_line(
            line_start[0], line_start[1], line_end[0], line_end[1]
        )

        line_start = line_end

        current_color_value = color_value
    line_end = [x_plotter_scale, y_plotter_scale]
    plotter.layers[COLOR_LAYERS[current_color_value]].add_line(
        line_start[0], line_start[1], line_end[0], line_end[1]
    )

plotter.preview()
plotter.save()