2023-12-09 Bayer Pattern CMYK
Description
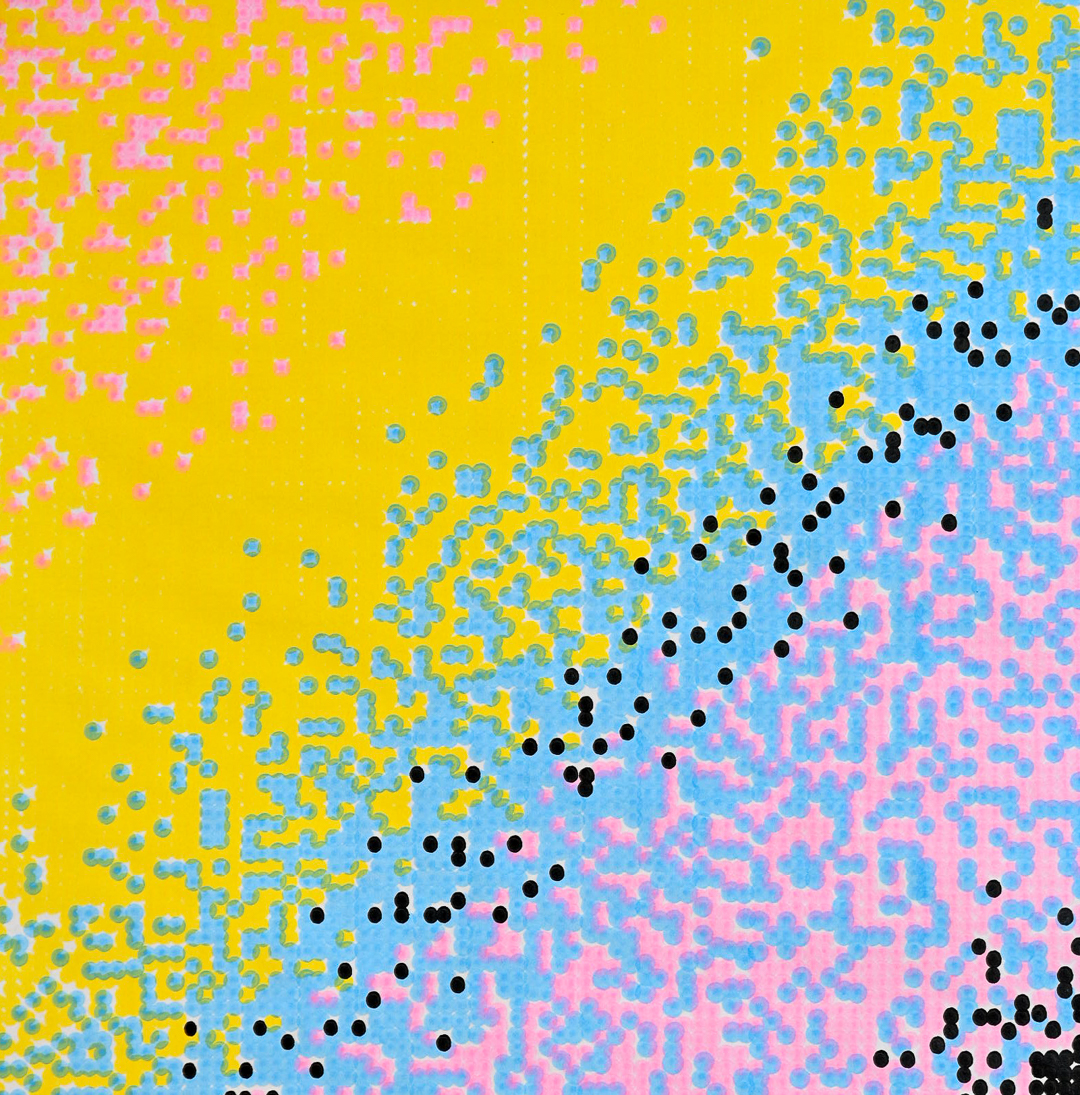
An exploration into making bayer filters but with CMYK instead of RGB.
Images
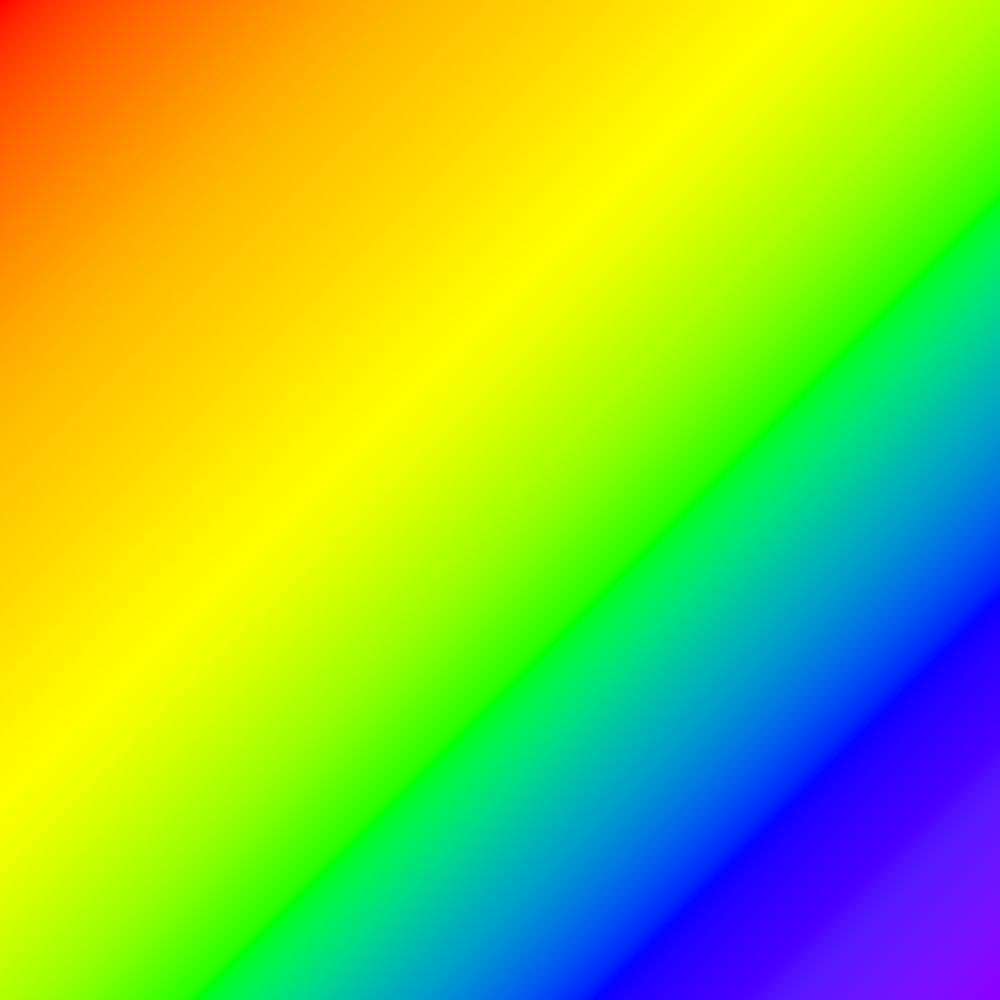
Inputs
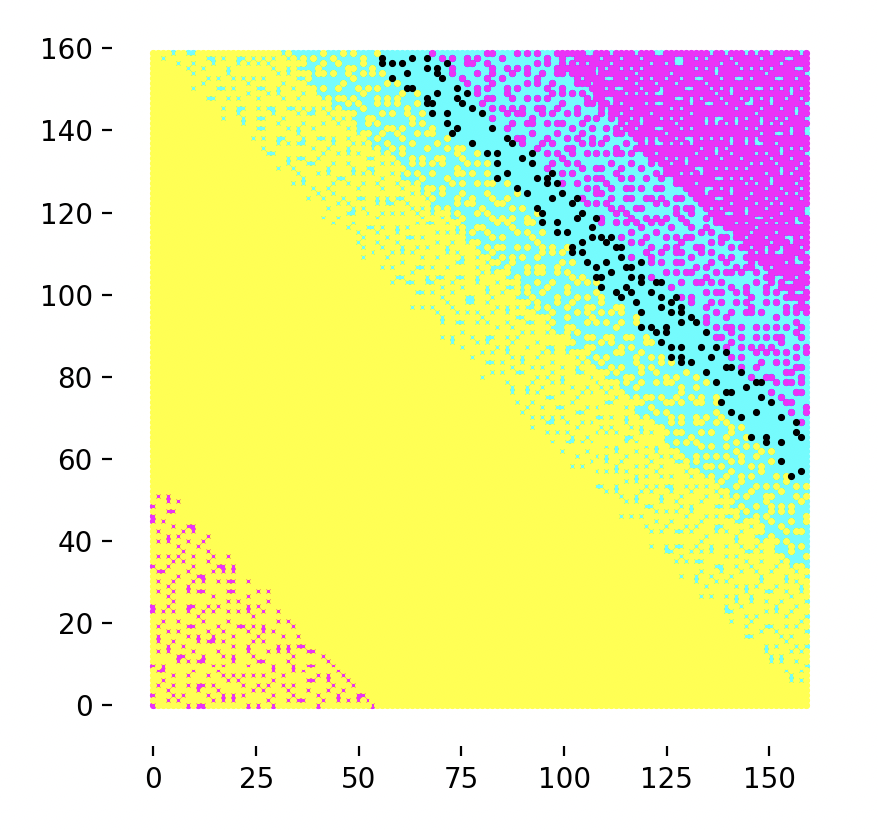
Plotter Preview
Code
warning
This code may or may not run and is intended more as a reference. Additionally, it was most likely not written with the latest version of the library. To ensure compatibility, check the date of this post against the version history and install the corresponding version.
from gcode2dplotterart import Plotter2D
import cv2
from typing import List, Tuple
from random import shuffle
import time
import math
import imutils
import numpy as np
from scipy.cluster.vq import kmeans, vq

plotter = Plotter2D(
    title="CMYK Bayer Patterns",
    x_max=160,
    x_min=0,
    y_max=160,
    y_min=0,
    feed_rate=10000,
    include_comments=False,
)

LINE_WIDTH = 2.5  # mm

CYAN_LAYER = "cyan"
MAGENTA_LAYER = "magenta"
YELLOW_LAYER = "yellow"
BLACK_LAYER = "black"
WHITE_LAYER = "white"


def bgr_to_cmyk(bgr_color):
    b, g, r = [x / 255.0 for x in bgr_color]

    c = 1 - r
    m = 1 - g
    y = 1 - b

    k = min(c, m, y)

    c = (c - k) / (1 - k) if 1 - k != 0 else 0
    m = (m - k) / (1 - k) if 1 - k != 0 else 0
    y = (y - k) / (1 - k) if 1 - k != 0 else 0

    c, m, y, k = [round(x * 100) for x in (c, m, y, k)]

    return c, m, y, k


LAYERS = [CYAN_LAYER, MAGENTA_LAYER, YELLOW_LAYER, BLACK_LAYER, WHITE_LAYER]

for layer in LAYERS:
    plotter.add_layer(title=layer, color=layer, line_width=LINE_WIDTH)


def kmeans_algorithm(pixels, k=1):
    # Convert the pixel array to a NumPy array
    pixel_array_np = np.array(pixels)

    # Flatten the array to 1D for kmeans
    flattened_array = pixel_array_np.reshape(-1, 4)

    centroids, _ = kmeans(flattened_array.astype(float), k)

    # Assign each pixel to the nearest centroid
    labels, _ = vq(flattened_array, centroids)

    # Calculate the average CMYK for each cluster
    average_cmyk_colors = [
        tuple(np.mean(flattened_array[labels == i], axis=0).astype(int))
        for i in range(k)
    ]

    return average_cmyk_colors[0]


def sample_img_and_get_cmyk_ratio(sample_square, pixels_per_sample_side):
    if sample_square.shape != (pixels_per_sample_side, pixels_per_sample_side, 4):
        raise ValueError(
            f"Input sample must be a {pixels_per_sample_side}x{pixels_per_sample_side} square with 4 color channels."
        )

    cmyk_value = kmeans_algorithm(sample_square, k=3)

    # This ratio calculation might be incorrect.
    cmyk_ratios = [value / sum(cmyk_value) * 100 for value in cmyk_value]
    return {
        CYAN_LAYER: cmyk_ratios[0],
        MAGENTA_LAYER: cmyk_ratios[1],
        YELLOW_LAYER: cmyk_ratios[2],
        BLACK_LAYER: cmyk_ratios[3],
    }


def read_and_prep_image(
    filename: str,
    pixels_per_sample_side: int,
    resize_percent: float = 1.0,
) -> List[List[Tuple[int, int, int]]]:
    """
    Resize the image such that the side lengths are divisible by the number of pixels that will be used to represent each dot.(pixels_per_sample)

    Params:
      filename: The name of the image file to read in.
      pixels_per_sample_side: the number of pixels, along a side to sample. Used to round the image size such that samples per side becomes an int
      resize_percent: Whether or not to resize the image. If true, the image will be resized to the specified percentage of the original image size.
    """

    img = cv2.imread(filename)  # Reads in image as BGR
    print("original image shape", img.shape)
    if pixels_per_sample_side > img.shape[0] or pixels_per_sample_side > img.shape[1]:
        raise ValueError("pixels_per_sample_side must be less than the image size")

    img = imutils.resize(img, width=int(img.shape[1] * resize_percent))

    rounded_width = int(
        math.floor(img.shape[0] / pixels_per_sample_side) * pixels_per_sample_side
    )
    rounded_height = int(
        math.floor(img.shape[1] / pixels_per_sample_side) * pixels_per_sample_side
    )

    # Resize expects width, height unlike in just about every other place.
    img = cv2.resize(img, (rounded_width, rounded_height))
    print("rounded image shape", img.shape)

    img = np.apply_along_axis(bgr_to_cmyk, 2, img)
    print("converted bgr to cmyk")
    return img


def image_to_cmyk_color_ratios(
    img: List[List[Tuple[int, int, int]]], pixels_per_sample_side: int
):
    """
    Take in an image, and return a 2D list of colors to plot as output.

    Params:
      img: The image to process
      pixels_per_sample_side: the number of pixels, along a side to sample. The number of pixels would then be pixels_per_sample_side**2.
    """

    output = []

    for starting_col in range(0, len(img[0]), pixels_per_sample_side):
        output_row = []
        for starting_row in range(0, len(img), pixels_per_sample_side):
            img_section = img[
                starting_row : starting_row + pixels_per_sample_side,
                starting_col : starting_col + pixels_per_sample_side,
            ]
            cmyk_ratio = sample_img_and_get_cmyk_ratio(
                img_section, pixels_per_sample_side
            )
            output_row.append(cmyk_ratio)
        # Plotting is done from the bottom left corner, so we need to reverse the order of the rows.
        output.append(output_row)

    return output


def plot_points_per_cmyk_ratio(
    cmyk_ratio,
    x_start_mm,
    y_start_mm,
    mm_per_sample_side,
    points_per_sample_side,
):
    points = []
    for color, percentage in cmyk_ratio.items():
        num_points = int(percentage / 100 * points_per_sample_side**2)
        for i in range(num_points):
            points.append(color)

    # Need to handle the situation where the number of points is less than the number of points per sample side.
    # One such way this occurs is if the points_per_sample_side is odd.
    filtered_dict = {k: v for k, v in cmyk_ratio.items() if v != 0}
    # Sort the dictionary by values in descending order
    cmyk_ratio_keys = list(
        dict(
            sorted(filtered_dict.items(), key=lambda item: item[1], reverse=True)
        ).keys()
    )

    current_index = 0
    while len(points) < points_per_sample_side**2:
        # White is the only color where all the percentages are 0.
        if len(cmyk_ratio_keys) == 0:
            points.append("white")
            continue

        points.append(cmyk_ratio_keys[current_index % len(cmyk_ratio_keys)])
        current_index += 1

    shuffle(points)

    x_spacing = mm_per_sample_side / points_per_sample_side
    y_spacing = mm_per_sample_side / points_per_sample_side

    for i in range(points_per_sample_side):
        for j in range(points_per_sample_side):
            x = x_start_mm + i * x_spacing
            y = y_start_mm + j * y_spacing
            plot_color = points.pop()

            plotter.layers[plot_color].add_point(
                x=x,
                y=y,
            )


def main():
    filename = "./desktop.png"

    # The number of pixels to sample along a side of the image. If an image is 100x100, and pixels_per_sample_side is 10, then there will be 10x10 samples.
    pixels_per_sample_side = 15

    # The number of points to plot per sample. If points_per_sample_side is 2, then there will be 4 points per sample.
    # The higher the number of points per sample, the more accurate the color will be, but the longer it will take to plot.
    points_per_sample_side = 2

    # Resize image to render faster, useful for testing
    resize_percent = 1

    # ========================================================================================================
    # Don't modify anything below these lines
    # ========================================================================================================

    start_time = time.time()

    # It is useful to set the resize_percent to a lower number while iterating
    img = read_and_prep_image(
        filename, pixels_per_sample_side, resize_percent=resize_percent
    )
    [rows, columns, color_channels] = img.shape
    print(img[0][0])
    width_samples = rows / pixels_per_sample_side
    height_samples = columns / pixels_per_sample_side

    print("width samples", width_samples)
    print("height samples", height_samples)

    mm_per_sample_width = plotter.width / width_samples
    mm_per_sample_height = plotter.height / height_samples

    print("mm per sample width", mm_per_sample_width)
    print("mm per sample height", mm_per_sample_height)

    # To maintain an aspect ratio and have all points fit on the canvas, we need to use the smaller of the two mm_per_sample values.
    mm_per_sample_side = min(mm_per_sample_width, mm_per_sample_height)
    print("mm", mm_per_sample_side)
    cmyk_color_ratios = image_to_cmyk_color_ratios(
        img, pixels_per_sample_side=pixels_per_sample_side
    )

    for row_index, row in enumerate(cmyk_color_ratios):
        for col_index, cmyk_ratio in enumerate(row):
            x_start_mm = col_index * mm_per_sample_side
            y_start_mm = row_index * mm_per_sample_side
            plot_points_per_cmyk_ratio(
                cmyk_ratio=cmyk_ratio,
                x_start_mm=x_start_mm,
                y_start_mm=y_start_mm,
                mm_per_sample_side=mm_per_sample_side,
                points_per_sample_side=points_per_sample_side,
            )

    end_time = time.time()
    print(f"Total time: {end_time - start_time}")
    plotter.preview()
    plotter.save()


if __name__ == "__main__":
    main()