2023-11-24 Concentric Circles
Description
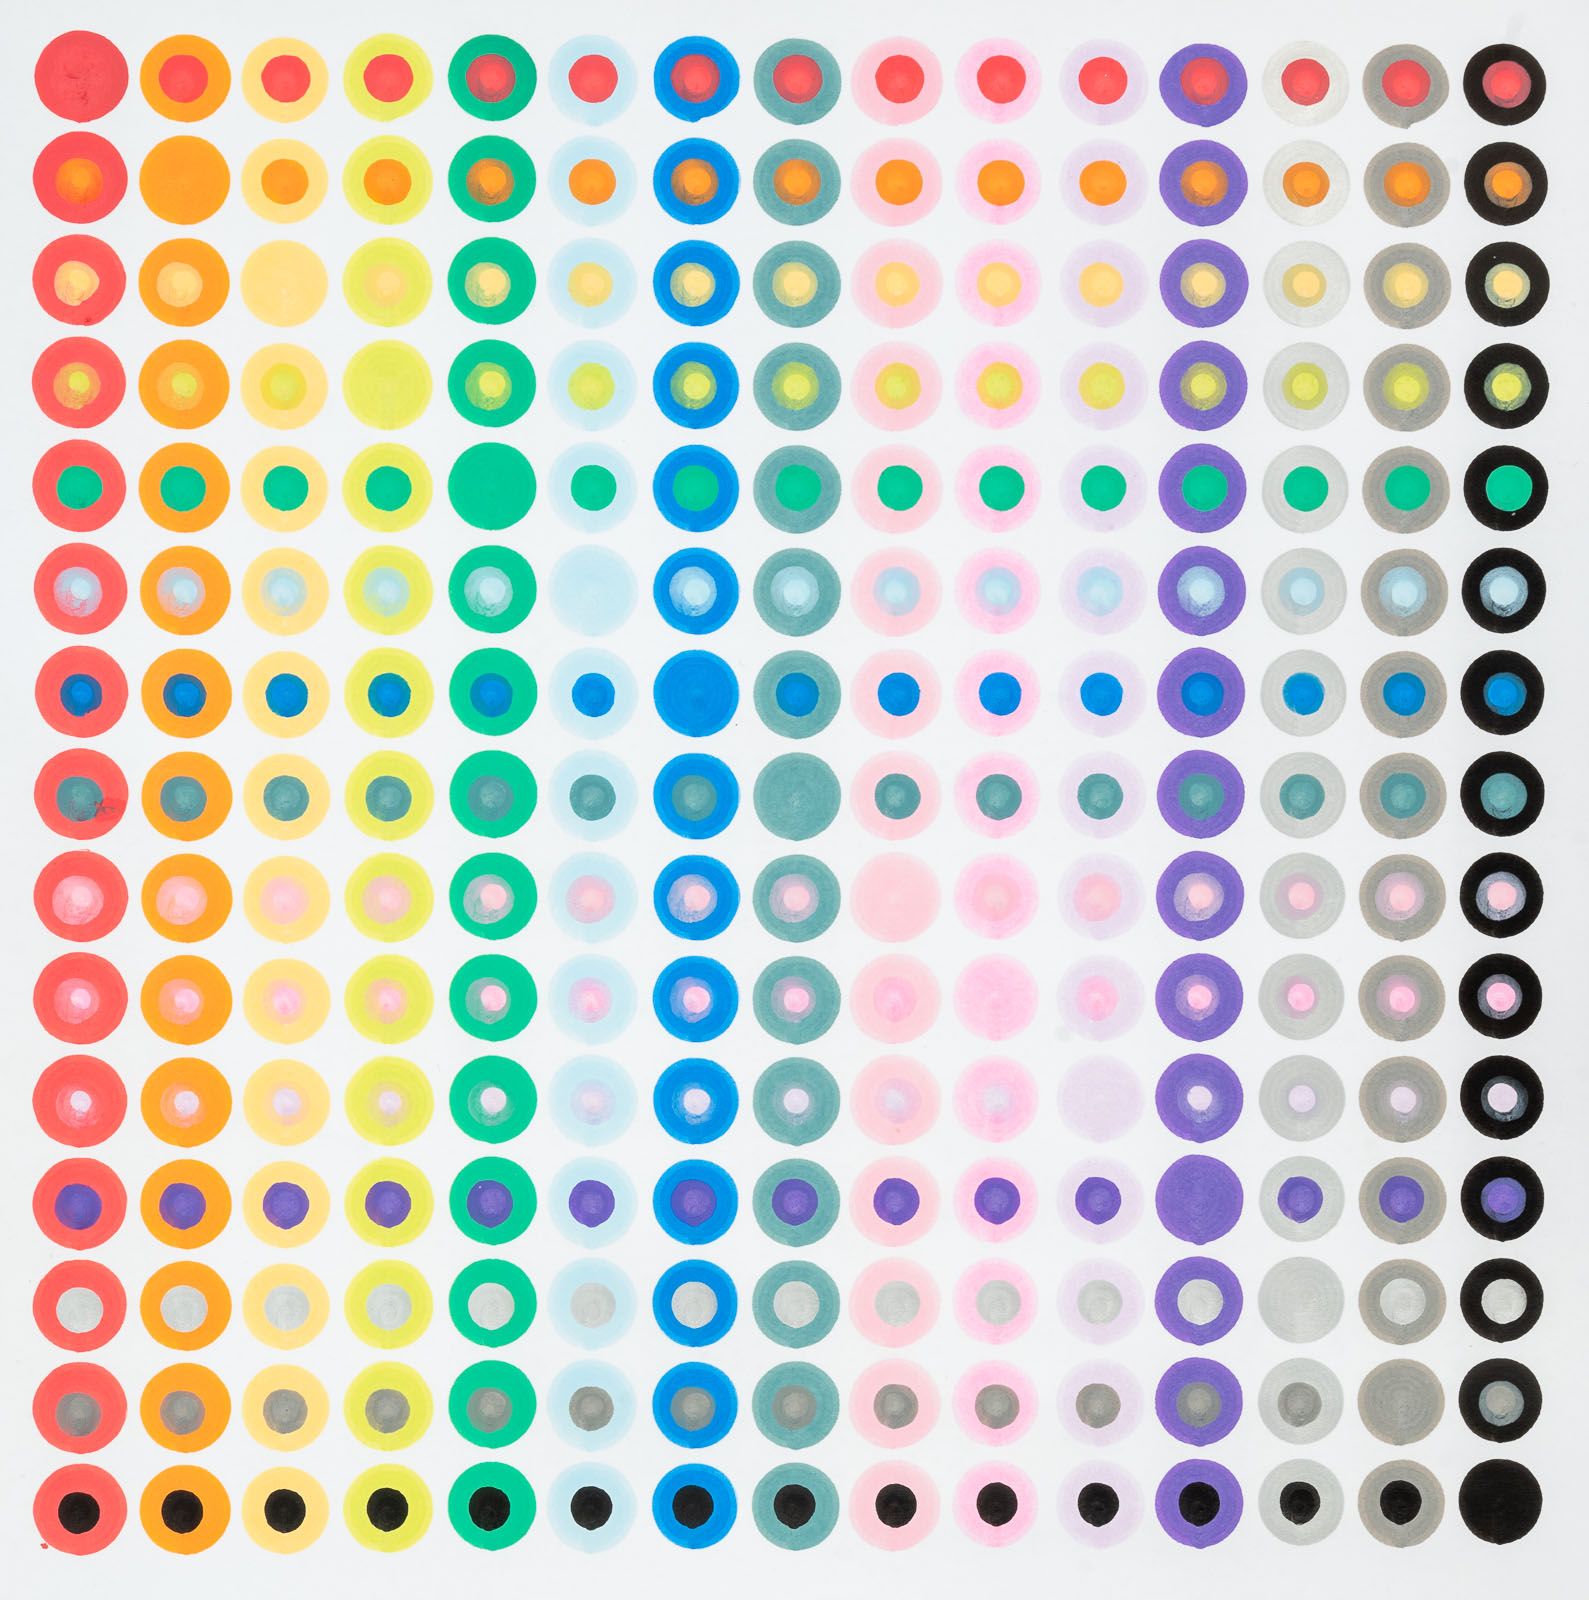
Plot circles in a 2D grid where each row contains a donut of a single color and each column contains a circle enclosed in the donut of a single color. The result is a grid containing the unique combination of every color pair.
Images
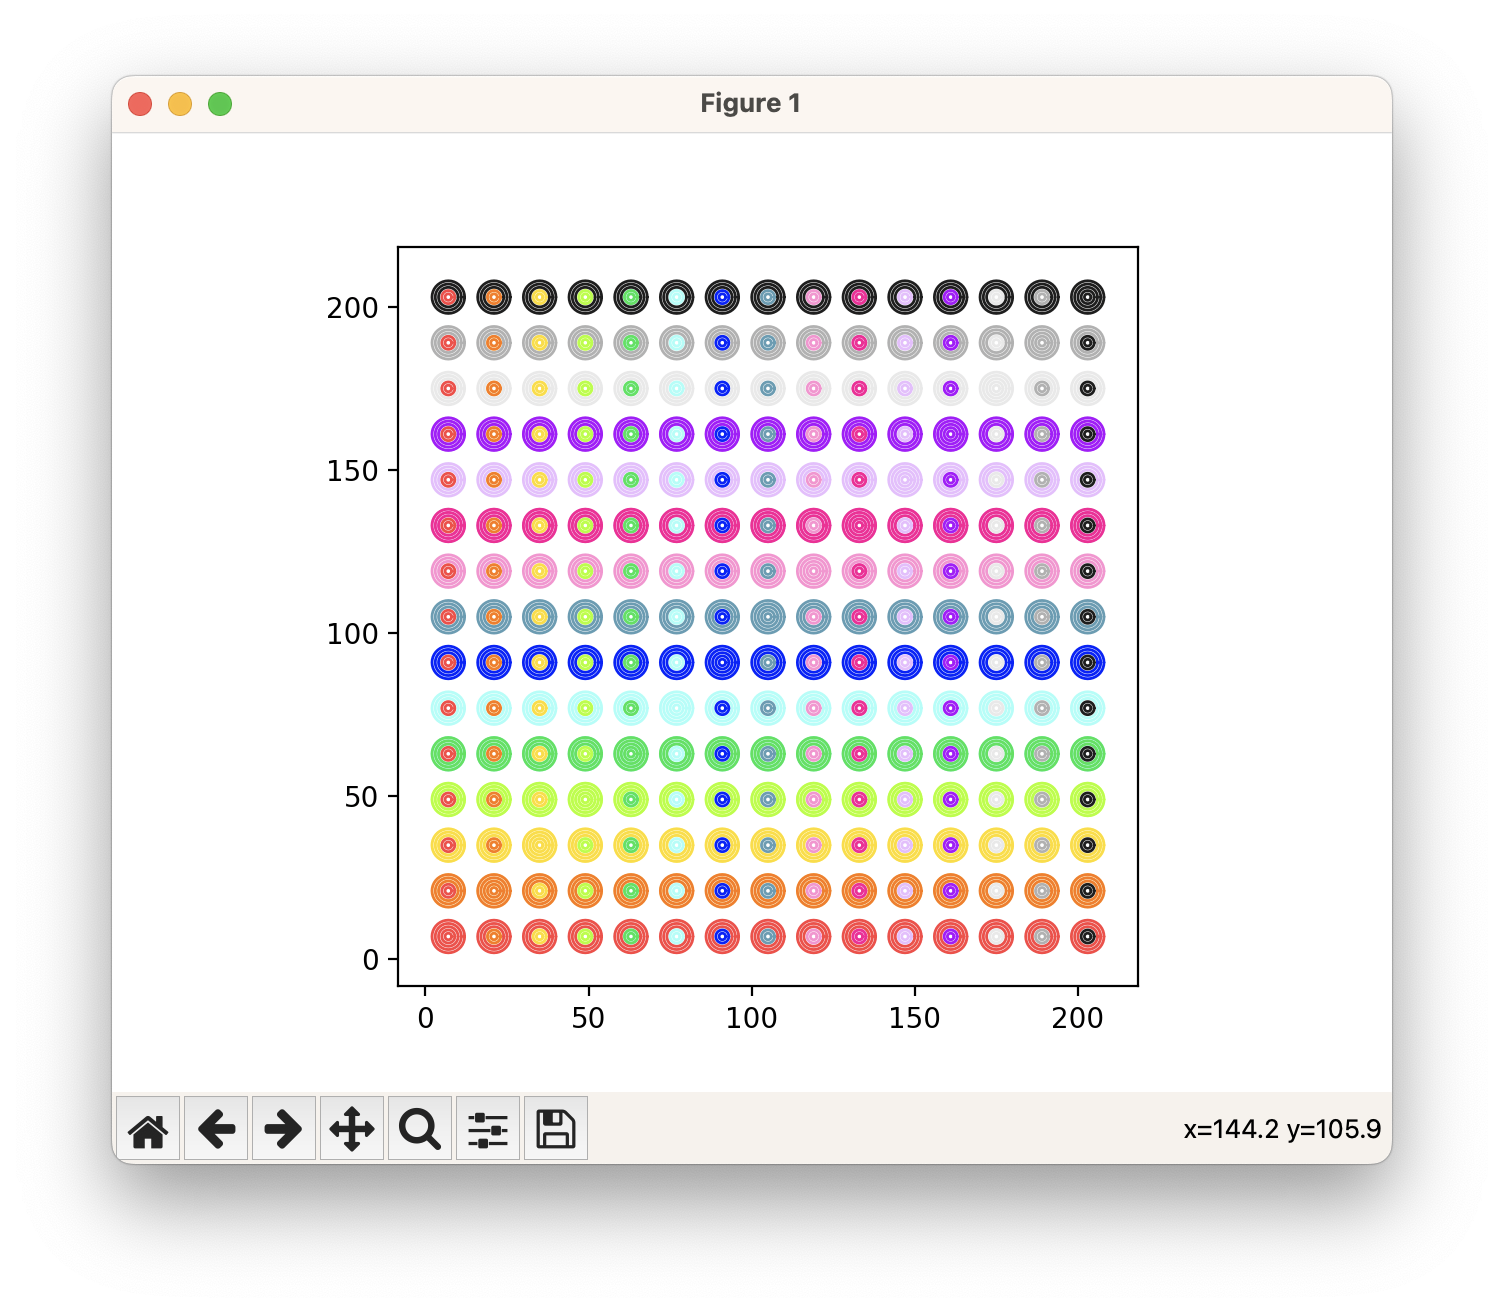
Plotter Preview
Code
warning
This code may or may not run and is intended more as a reference. Additionally, it was most likely not written with the latest version of the library. To ensure compatibility, check the date of this post against the version history and install the corresponding version.
from gcode2dplotterart import Plotter2D

LINE_WIDTH = 1.0

COLORS = [
    {"title": "1_red1", "color": "#FF4141"},
    {"title": "2_orange1", "color": "#FF7700"},
    {"title": "3_yellow1", "color": "#FFDB11"},
    {"title": "4_green1", "color": "#A9FF00"},
    {"title": "5_green2", "color": "#00E350"},
    {"title": "6_blue1", "color": "#A2FFF8"},
    {"title": "7_blue2", "color": "#0024FF"},
    {"title": "8_blue3", "color": "#5D9DB4"},
    {"title": "9_pink1", "color": "#FF91D2"},
    {"title": "a_pink2", "color": "#FF0096"},
    {"title": "b_purple1", "color": "#EABEFF"},
    {"title": "c_purple2", "color": "#AD00FF"},
    {"title": "d_grey1", "color": "#E9E9E9"},
    {"title": "e_grey2", "color": "#B1B1B1"},
    {"title": "f_grey3", "color": "#1E1E1E"},
]

# Create a plotter object
plotter = Plotter2D(
    title="Circles",
    x_min=0,
    x_max=290,
    y_min=0,
    y_max=210,
    feed_rate=10000,
)

for color in COLORS:
    for ground in ["foreground", "background"]:
        plotter.add_layer(
            title=f"{ground}_{color['title']}",
            color=color["color"],
            line_width=LINE_WIDTH,
        )

PLOTTER_CONSTRAINT = min(plotter.width, plotter.height)

bounding_box = PLOTTER_CONSTRAINT / len(COLORS)
radius = (bounding_box / 2) - 2  # Add a little padding

INNER_CIRCLE_RADIUS = radius * 0.5

print

for foreground_index in range(len(COLORS)):
    for background_index in range(len(COLORS)):
        # Experimenting below with adding fill.

        # offset centers so they're not on edge of plotter
        foreground_offset = foreground_index + 0.5
        background_offset = background_index + 0.5

        remaining_radius = radius
        print(remaining_radius)
        while remaining_radius > INNER_CIRCLE_RADIUS:
            plotter.layers[
                "background_" + COLORS[background_index]["title"]
            ].add_circle(
                x_center=bounding_box * foreground_offset,
                y_center=bounding_box * background_offset,
                radius=remaining_radius,
            )
            remaining_radius -= LINE_WIDTH

        while remaining_radius > 0:
            layer = (
                "foreground_" + COLORS[foreground_index]["title"]
                if foreground_index != background_index
                else "background_" + COLORS[background_index]["title"]
            )
            plotter.layers[layer].add_circle(
                x_center=bounding_box * foreground_offset,
                y_center=bounding_box * background_offset,
                radius=remaining_radius,
            )
            remaining_radius -= LINE_WIDTH
        print(remaining_radius)

plotter.preview()

plotter.save(include_layer_number=False)